. 2025 Oct;94(4):1529-1545.
doi: 10.1002/mrm.30583. Epub 2025 May 25.

MRI-based quantification of whole-organ renal metabolic rate of oxygen during free-breathing

Affiliations

MRI-based quantification of whole-organ renal metabolic rate of oxygen during free-breathing

Nada Kamona et al. Magn Reson Med. 2025 Oct.

Abstract

Purpose: Renal metabolic rate of oxygen (rMRO2) reflects the kidney's metabolic efficiency, making it a potential biomarker for early-stage kidney disease. This study introduces an ungated, free-breathing MRI sequence in comparison to its breath-hold counterpart to noninvasively measure whole-organ rMRO2.

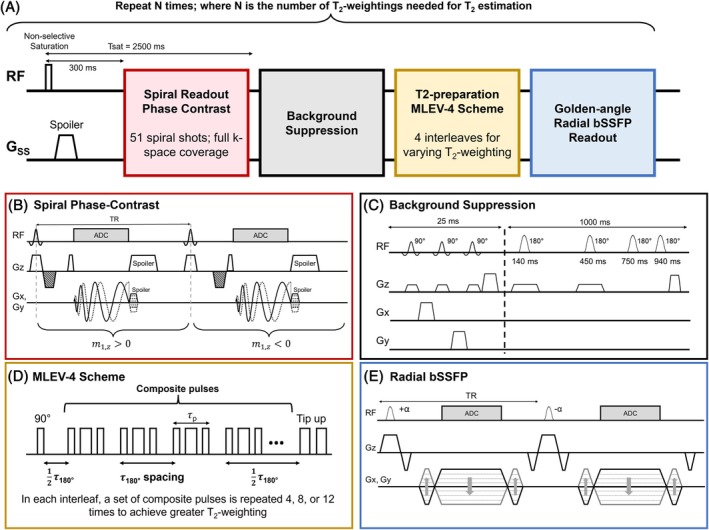
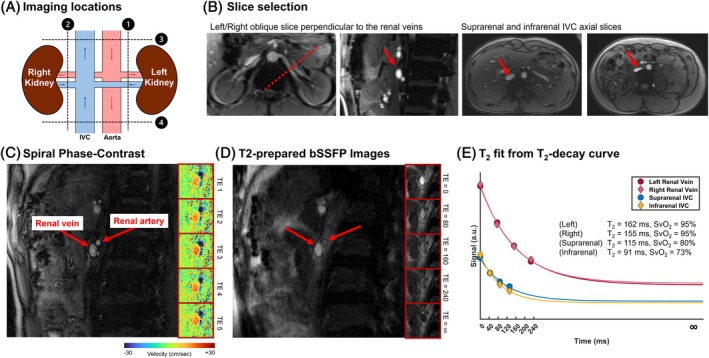
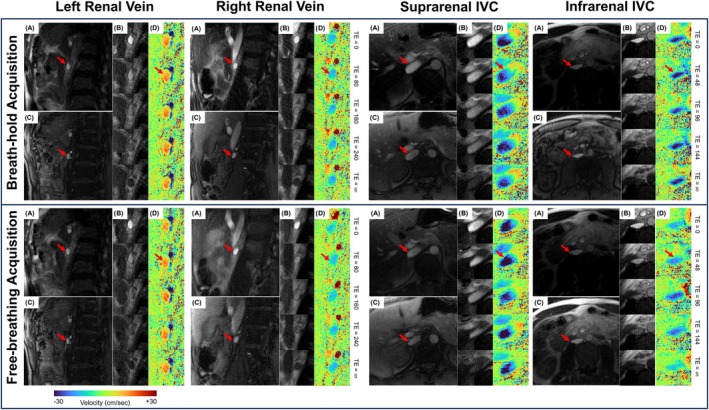
Methods: Free-breathing (FB) K-MOTIVE sequence (kidney metabolism of oxygen via T2 and interleaved velocity encoding) was developed to simultaneously measure renal blood flow rate (BFR) and T2 of blood water using the conservation of mass. T2 is converted to venous oxygen saturation (SvO2) using a calibration curve. Compared to previous versions, FB K-MOTIVE minimizes respiratory motion artifacts by acquiring fully sampled velocity maps with spiral readout instead of partially collecting radial views at each T2 weighting. Healthy participants (n = 15, 32 ± 9 years) were imaged at 3 T at the renal veins to quantify individual rMRO2, and at the suprarenal and infrarenal inferior vena cava to indirectly quantify bilateral rMRO2 (the total metabolism from both kidneys).

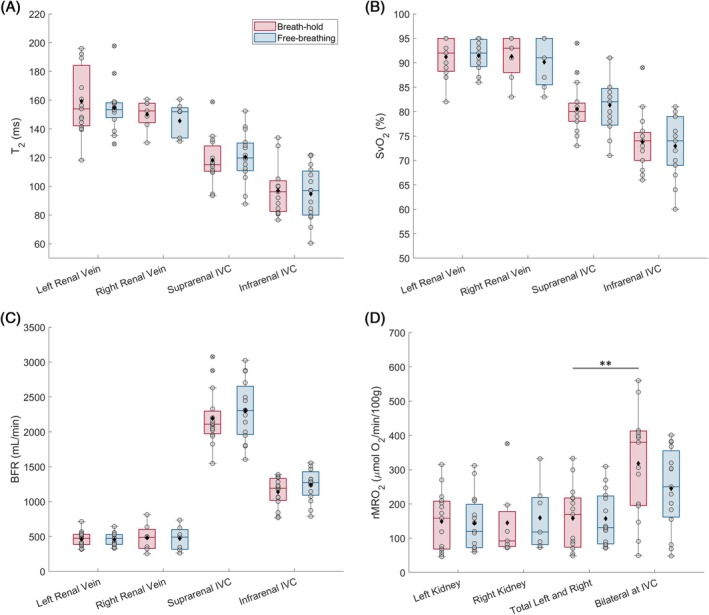
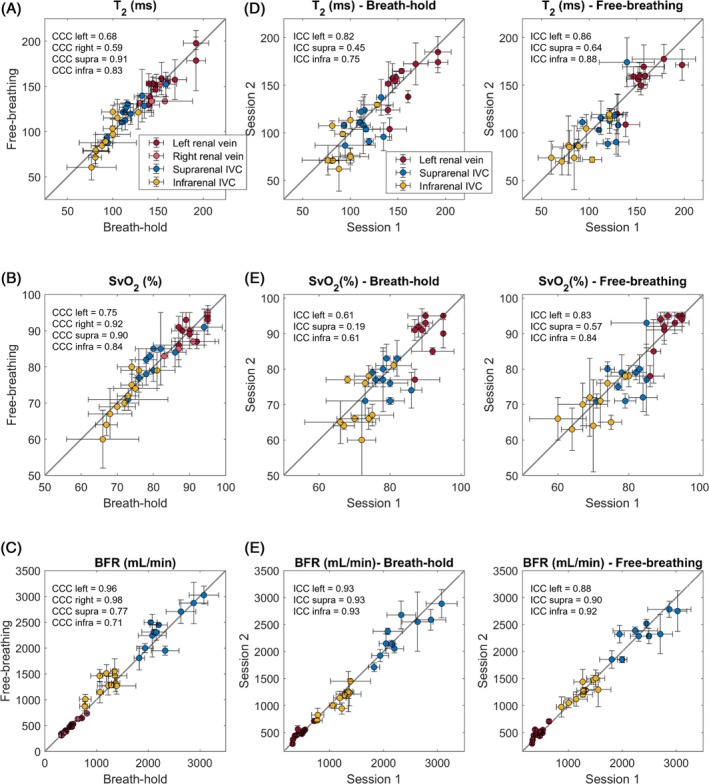
Results: Renal venous blood was highly oxygenated (SvO2 91% ± 3%) and exhibited high BFR of 460 ± 90 mL/min per kidney. Further, total rMRO2 of the two kidneys (160 ± 80 (μmol O2/min)/100 g) was statistically comparable to the indirect bilateral rMRO2 (250 ± 120 (μmol O2/min)/100 g, p = 0.066). Using Lin's concordance correlation coefficient, there was good agreement between breath-hold and free-breathing acquisitions at the individual kidneys for SvO2 (>0.75), BFR (>0.96), and rMRO2 (>0.75).

Conclusion: FB K-MOTIVE is a feasible approach to estimate rMRO2, yielding reproducible and physiologically plausible metabolic parameters. Free-breathing acquisition can enhance patient comfort by eliminating the need for breath-holding.

Keywords: MRI; kidney; metabolism; oxygenation.


Figures

FIGURE 1
FIGURE 1
A simplified sequence diagram of FB K‐MOTIVE. (A) The main building blocks of the sequence. (B) 2D PC module with spiral readout to measure renal blood flow. (C) Background suppression module to suppress signal from static tissue. (D) MLEV‐4 for T2‐preparation. (E) 2D golden‐angle radial bSSFP module. bSSFP, balanced steady‐state free precession; FB, free‐breathing; K‐MOTIVE, kidney metabolism of oxygen via T2 and interleaved velocity encoding; MLEV‐4, Malcolm‐Levitt T2‐preparation scheme; PC, phase‐contrast.
FIGURE 2
FIGURE 2
Overview of imaging locations and FB K‐MOTIVE sequence outputs. (A) Schematic of four imaging slices along the dashed black lines at the left and right renal veins, as well as the suprarenal and infrarenal IVC. (B) TOF localizer images are used to select oblique slices perpendicular to the renal vessels and axial slices for the IVC locations. (C) First FB K‐MOTIVE output is a set of five magnitude and velocity maps, with the magnified velocity maps showing the renal vessels. (D) The second FB K‐MOTIVE output is a set of T2‐prepared bSSFP images at five effective TEs, with the magnified images illustrating the signal decay in the vessel. (E) T2‐fit from the signal decay curve for all imaging locations, which is then converted to SvO2 using a calibration model given the subject's hematocrit. IVC, inferior vena cava; SvO2, venous oxygen saturation; TOF, time of flight.
FIGURE 3
FIGURE 3
FB K‐MOTIVE output images for one representative healthy participant (30 yo male) at the left renal vein, right renal vein, suprarenal IVC, and infrarenal IVC, all acquired in the same scan session. (Top row) acquisition during a 22‐s breath‐hold. (Bottom row) acquisition during 22 s of free breathing. (A) T2‐prepared and background suppressed bSSFP image at TE = 0, whereas (B) shows the magnified images at longer effective TEs, illustrating the signal decay of renal venous blood. (C) Magnitude image from the spiral PC module at TE = 0. (D) Five magnified images of the velocity maps from the PC module at every TE. Red arrows point to the corresponding blood vessel in each column.
FIGURE 4
FIGURE 4
Metabolic parameters across all imaging locations and breathing maneuver type. (A) T2, (B) SvO2, (C) BFR, and (D) rMRO2. In (D), the supra‐ and infrarenal IVC were combined using the modified bilateral Fick principle equation to estimate bilateral rMRO2 of the two kidneys. Additionally, in (D), the total rMRO2 of the left and right kidney given their total mass was computed to create a benchmark comparison for the bilateral rMRO2 derived from measurements at the IVC. The box outlines represent the 25th, 50th, and 75th percentiles; and the whiskers indicate the nonoutlier data range. The black diamonds represent average values; the gray circles are individual subjects; and the cross shapes are outliers. Linear mixed effects models were used to test for group differences with **p < 0.001. BFR, blood flow rate; rMRO2, renal metabolic rate of oxygen; SvO2, venous oxygen saturation.
FIGURE 5
FIGURE 5
Agreement of direct K‐MOTIVE outputs between breath‐hold and free‐breathing acquisitions for (A) T2, (B) SvO2, and (C) BFR using Lin's CCC. All imaging locations have data from 15 participants, except the right renal vein (n = 7). Reproducibility of measurements across two imaging sessions in 10 participants during breath‐hold and free‐breathing acquisitions for (D) T2, (E) SvO2, and (F) BFR, using ICC. The data from the right renal vein is not shown due to a smaller sample size in the reproducibility session (n = 4). CCC, concordance correlation coefficient; ICC, intraclass correlation coefficient.
FIGURE 6
FIGURE 6
Intrasession (row A) and intersession (row B) reproducibility assessed using CoV = σ/μ for all metabolic parameters and imaging locations. The bars' length and standard error bars represent the average CoV and SD across all participants (n = 15, or n = 7 for the right kidney). CoV, coefficient of variation.
FIGURE 7
FIGURE 7
The effect of interleaving and stacking (i.e., continuous) PC module in FB K‐MOTIVE on BFR in the renal veins and IVC. (A) Correlation plots of interleaved and stacked PC results during free‐breathing at all four imaging locations, with the agreement assessed using Lin's CCC. Each circle and error bars are the average and SD of three measurements acquired per participant (total n = 15, except right kidney n = 7). (B) Bilateral BFR at the IVC compared to the BFR sum of left and right renal veins across all participants, under breath‐hold (interleaved PC) and free‐breathing (interleaved or stacked PC) conditions. The box outlines represent the 25th, 50th, and 75th percentiles, and the whiskers indicate the nonoutlier data range. The black diamonds represent average values; the gray circles are individual subjects; and the cross shapes are outliers. A mixed effects model was used to test for group differences with p‐values: **p < 0.001, ***p < 0.0001.

Similar articles

References

    1. Hesp AC, Schaub JA, Prasad PV, et al. The role of renal hypoxia in the pathogenesis of diabetic kidney disease: a promising target for newer renoprotective agents including SGLT2 inhibitors? Kidney Int. 2020;98:579‐589. - PMC - PubMed
    1. Hansell P, Welch WJ, Blantz RC, Palm F. Determinants of kidney oxygen consumption and their relationship to tissue oxygen tension in diabetes and hypertension. Clin Exp Pharmacol Physiol. 2013;40:123‐137. - PMC - PubMed
    1. Fine LG, Norman JT. Chronic hypoxia as a mechanism of progression of chronic kidney diseases: from hypothesis to novel therapeutics. Kidney Int. 2008;74:867‐872. - PubMed
    1. Mimura I, Nangaku M. The suffocating kidney: tubulointerstitial hypoxia in end‐stage renal disease. Nat Rev Nephrol. 2010;6:667‐678. - PubMed
    1. Wang B, Li ZL, Zhang YL, Wen Y, Gao YM, Liu BC. Hypoxia and chronic kidney disease. EBioMedicine. 2022;77:103942. - PMC - PubMed