. 2025 May 9:16:1567183.
doi: 10.3389/fpls.2025.1567183. eCollection 2025.

Optimization of the optimal hormone formula for kiwifruit and analysis of its storage characteristics

Affiliations

Optimization of the optimal hormone formula for kiwifruit and analysis of its storage characteristics

Xiaoe He et al. Front Plant Sci. .

Abstract

Introduction: Kiwifruit is susceptible to ripening and senescence during postharvest storage, leading to fruit softening, rotting, and nutrient loss, affecting commercial and economic values. Hormones delay senescence by regulating fruit physiology and metabolism, but their specific effects and mechanisms must be further investigated.

Methods: To extend the postharvest storage duration of kiwifruit, we conducted a study using 'Yan Nong 3' kiwifruit as our test material. The fruits were treated with varying concentrations of Brassinolide (BRs), melatonin (MT), methyl jasmonate (MeJA) and salicylic acid (SA), respectively. Subsequently, on the basis of a one-way test, an orthogonal experiment was designed with fruit hardness as an indicator (7 days of storage at room temperature) to obtain the optimal process formulation for phytohormone synergistic treatment (PEHC): 10 μmol·L-1 for BRs, 200 μmol·L-1 for MT, 300 μmol·L-1 for MeJA, and 2 mmol·L-1 for SA.

Results: The results showed that after 60 days of storage at 4°C, PEHC was found to increase the good fruit rate and the hardness of kiwifruit by 5.97% and 67.42%, respectively, compared to the control. PEHC reduced weight loss rate and disease index, slowed the decrease in titratable acid content (TAC) and vitamin C (VC) content, maintained color, and delayed the accumulation of SSC. At 80 days of storage, the hardness, good fruit rate, VC content, and TAC of PEHC increased by 68.38%, 28.87%, 32.76 mg·100 g-1, and 20.00%, respectively, compared to the control. Whereas, the difference in SSC of PEHC compared to control was nosignificant. The PEHC reduced the content of 1-Aminocyclopropane-1-carboxylate (ACC). Transcriptomics revealed that PEHC inhibited the gene expression levels of Acc08469 in s-adenosylmethionine synthetase (MetK), as well as Acc20538, Acc24995, and Acc17490 in 1-aminocyclopropane-1-carboxylic acid oxidase. Using metabolomics, PEHC increased the relative contents of acids and amino acids and decreased the relative contents of aroma, pigments or phenolics, and soluble sugars compared with the control, of which the trends of changes in acids and soluble sugars were consistently associated with the changes in fruit quality.

Discussion: The PEHC had a favorable effect on maintaining kiwifruit quality and delayed the decline in postharvest storage quality.

Keywords: hardness; hormones; kiwifruit; metabolomic; orthogonal experiment; quality; transcriptomic.


Conflict of interest statement

The authors declare that the research was conducted in the absence of any commercial or financial relationships that could be constructed as a potential conflict of interest.

Figures

Figure 1
Figure 1
The effect of different concentrations of brassinolide on the quality of postharvest kiwifruit. BRs, brassinolide. (A) weight loss rate. (B) good fruit rate. (C) hardness. (D) soluble solids content (SSC). Different lower case letters represent significant differences (p<0.05).
Figure 2
Figure 2
The effect of different concentrations of MT on the storage quality of kiwifruit. MT, Melatonin. (A) weight loss rate. (B) good fruit rate. (C) hardness. (D) soluble solids content (SSC). Different lower case letters represent significant differences (p<0.05).
Figure 3
Figure 3
Effect of MeJA concentration on storage quality of kiwifruit fruit. MeJA, Methyl jasmonate. (A) weight loss rate. (B) good fruit rate. (C) hardness. (D) soluble solids content (SSC). Different lower case letters represent significant differences (p<0.05).
Figure 4
Figure 4
The effect of salicylic acid concentration on the storage quality of kiwifruit. SA, Salicylic acid. (A) weight loss rate. (B) good fruit rate. (C) hardness. (D) soluble solids content (SSC). Different lower case letters represent significant differences (p<0.05).
Figure 5
Figure 5
Heat map of differences between treatments for the same indicator. (A) weight loss rate. (B) good fruit rate. (C) hardness. (D) soluble solids content (SSC). 1, 2, 3, 4 and 5 in the graph represent the concentration levels of different hormones, respectively (see Table 1 ).
Figure 6
Figure 6
Heat map of correlation between different indicators for each treatment. (A) Brassinolide. (B) Melatonin. (C) Methyl jasmonate. (D) Salicylic acid. Red indicates a positive correlation, blue indicates a negative correlation, The darker the color, the more significant the correlation. **P< 0.01. *P< 0.05.
Figure 7
Figure 7
Effect of the PEHC on weight loss rate and good fruit rate of postharvest kiwifruit. PEHC, Plant endogenous hormones complex. (A) Weight loss rate. (B) Good fruit rate. ****P<0.0001. ***P< 0.001. **P< 0.01.
Figure 8
Figure 8
Effect of the PEHC on postharvest kiwifruit hardness and disease index. PEHC, Plant endogenous hormones complex. (A) Hardness. (B) Disease index. ****P<0.0001. ***P< 0.001. **P< 0.01.
Figure 9
Figure 9
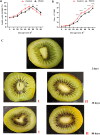
Effect of the PEHC on soluble solids content and color of kiwifruit. PEHC, Plant endogenous hormones complex. (A) Soluble solids content (SSC). (B) Color. (C) comparison of fruit flesh color between PEHC group (I) and control group (II). ****P<0.0001. ***P< 0.001. **P< 0.01. *P< 0.05.
Figure 10
Figure 10
Effect of the PEHC on TAC and VC content of kiwifruit. PEHC, Plant endogenous hormones complex. (A) Titration acid content (TAC). (B) VC content. ****P<0.0001. ***P< 0.001. **P< 0.01. *P< 0.05.
Figure 11
Figure 11
Heat map of correlation of quality indicators in hormone synergistic treatment groups. ***P< 0.001, *P< 0.05.
Figure 12
Figure 12
Heat map of correlation of quality indicators in the control. ***P< 0.001. **P< 0.01.
Figure 13
Figure 13
Compound classification (A) and KEGG (B) KEGG enrichment analysis of metabolites. In (A) the horizontal coordinate is Ratio, indicating the relative proportion of metabolite quantities in each classification, and the vertical coordinate is for each classification, with both bubble color and size indicating the Ratio value. In (B) the horizontal coordinate is the enrichment rate and the vertical coordinate is the KEGG pathway. The size of the bubbles in the graph represents how much of the pathway is enriched to compounds in the metabolic set, and the color of the bubbles indicates the size of the p-value for different enrichment significance.
Figure 14
Figure 14
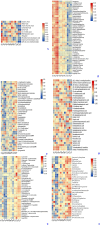
Heat map of differential metabolites (DAMs) between treatments. A1, A2, and A3 were treatment group A (kiwifruit stored at 4 °C for the second day). B1, B2, and B3 were treatment group B (kiwifruit stored at 4 °C for 30 days after PEHC treatment, at which point the control group begins to show signs of spoilage). C1, C2, and C3 were treatment group C (kiwifruit stored at 4 ° C for 30 days). (A) Acids. (B) Amino acids. (C) aroma. (D) fatty acids. (E) pigments or phenolics. (F) Soluble sugar.
Figure 15
Figure 15
Changes in ethylene synthesis metabolic pathway after PEHC treatment. k00789, S-adenosylmethionine synthetase (metK). k01762, 1-aminocyclopropane-1-carboxylic (ACC) synthase(ACS). k05933, aminocyclopropanecarboxylate oxidase (ACO). SAM, S-adenosyl-L-methionine. ACC, 1-Aminocyclopropane-1-carboxylate. (A) kiwifruit stored at 4°C on the 2nd day. (B) kiwifruit stored at 4°C on the 30th day after PEHC treatment. (C) kiwifruit stored at 4°C on the 30th day. Different lowercase letters indicate significant differences between different treatments (p<0.05).
Figure 16
Figure 16
qRT-PCR analysis of representative genes. A, kiwifruit stored at 4°C on the 2nd day. B, kiwifruit stored at 4°C on the 30th day after PEHC treatment. C, kiwifruit stored at 4°C on the 30th day. Different lowercase letters indicate significant differences between different treatments (p<0.05).

References

    1. Ali A., Rasool K., Ganai N. A., Lone I. A., Wani A. H., Malik K. M., et al. . (2022). Postharvest salicylic acid treatment affects weight loss, spoilage and biochemical attributes of bartlett pear fruits. Int. J. Plant Soil Sci. 34, 343–350. doi: 10.9734/ijpss/2022/v34i2131270 - DOI
    1. Baswal A. K., Dhaliwal H. S., Singh Z., Mahajan B. V. C., Gill K. S. (2020). Postharvest application of methyl jasmonate, 1-methylcyclopropene and salicylic acid extends the cold storage life and maintain the quality of ‘Kinnow’mandarin (Citrus nobilis L. X C. deliciosa L.) fruit. Postharvest Biol. Technol. 161, 111064. doi: 10.1016/j.postharvbio.2019.111064 - DOI
    1. Cai H. (2013). Effect of different treatments on fruit physiological and biochemical changes of aetinidia arguta (Jilin: Jilin Agricultural University; ).
    1. Cao J. K., Jiang W. B., Zhang Y. M. (2007). Guidelines for postharvest physiological and biochemical experiments on fruits and vegetables (China Agricultural University Press: Beijing; ).
    1. Cheng J., Zheng A., Li H., Huan C., Jiang T., Shen S., et al. . (2022). Effects of melatonin treatment on ethanol fermenation and ERF expression in kiwifruit cv. Bruno Dur. Postharvest. Sci. Hortic. 293, 110696. doi: 10.1016/j.scienta.2021.110696 - DOI

LinkOut - more resources