

Association of red blood cell distribution width-platelet ratio with mortality after coronary artery bypass grafting
- PMID: 40416608
- PMCID: PMC12103848
- DOI: 10.7717/peerj.19472
Association of red blood cell distribution width-platelet ratio with mortality after coronary artery bypass grafting
Abstract
Background: This study aims to explore the association between red blood cell distribution width-platelet ratio (RPR) and mortality in patients after coronary artery bypass grafting (CABG).
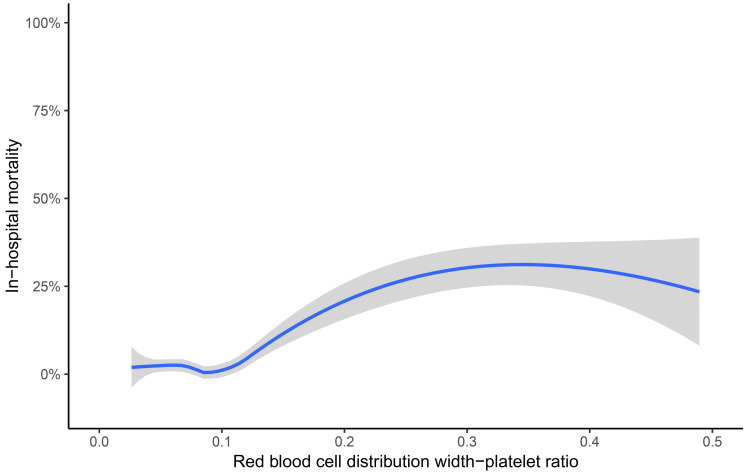
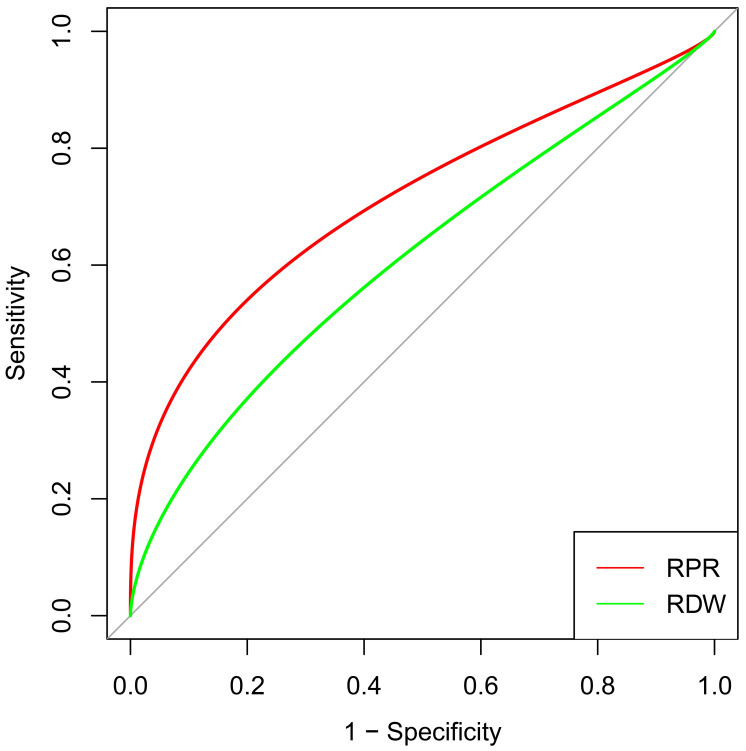
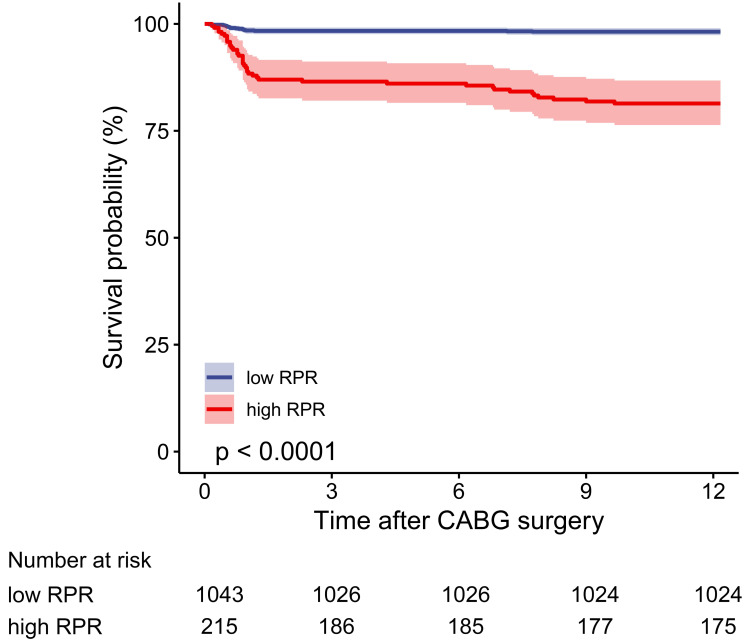
Methods: Data on patients who underwent CABG from January 1, 2021, to July 31, 2022, were retrospectively collected. The locally weighted scatter plot smoothing (Lowess) method was utilized to display the crude association between RPR and in-hospital mortality. The areas under the receiver operating characteristic curves (AUC) were used to assess the discrimination. The cut-off value (0.107) of RPR was calculated using the Youden index method. The primary outcome was in-hospital mortality.
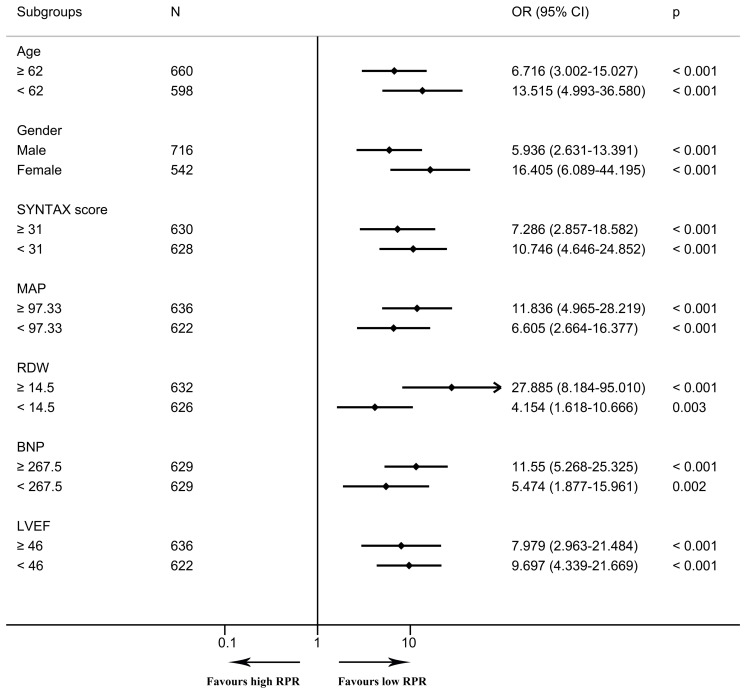
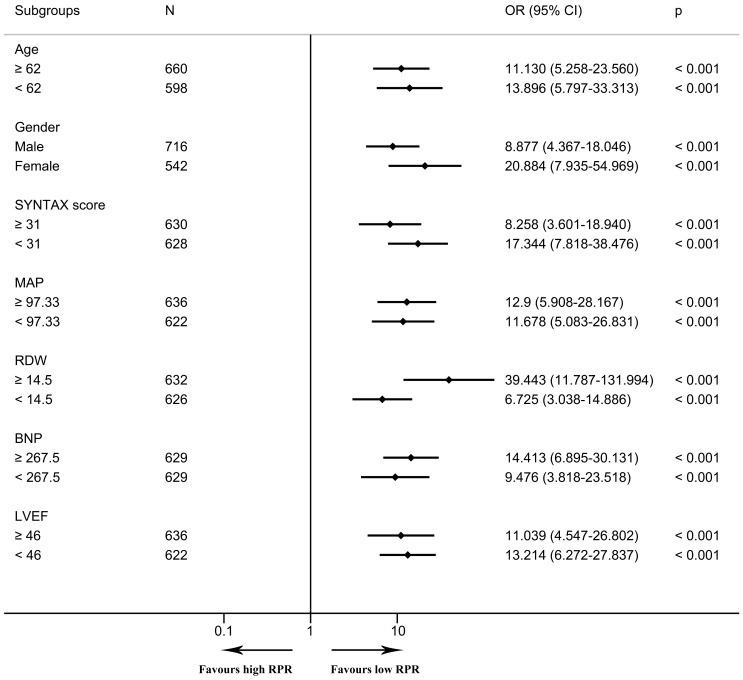
Results: In total, 1,258 patients were included. The Lowess curve showed an approximate positive linear relationship between RPR and in-hospital mortality. In the multivariable logistic regression model, RPR was an independent risk factor (OR 1.493, 95% CI [1.119-1.992] per standard deviation (SD) increase, p = 0.006) for in-hospital mortality after CABG. RPR (AUC 0.716, 95% CI [0.617-0.814]) demonstrated greater discrimination than RDW (AUC 0.578, 95% CI [0.477-0.680], p = 0.002). The cut-off value (0.107) of RPR was calculated for further analysis, and groups were further divided into the high RPR group (≥ 0.107) and the low RPR group (< 0.107). In the multivariable logistic regression model, high RPR (≥ 0.107) correlated with elevated risks of in-hospital mortality (OR 6.097, 95% CI [2.308-16.104], p < 0.001) and one-year mortality (OR 6.395, 95% CI [2.610-15.666], p < 0.001) after adjusting for all included covariates. Subgroup analyses revealed that high RPR consistently had increased risks of in-hospital mortality and one-year mortality. Besides, patients with low RPR show better one-year survival than those with high RPR.
Conclusion: Preoperative high RPR could serve as an independent risk predictor for in-hospital mortality and one-year mortality, which can be utilized to assess the prognosis of patients and further provide guidance for the treatment in patients following CABG.
Keywords: Coronary artery bypass grafting; In-hospital mortality; Red blood cell distribution width-platelet ratio.
©2025 Zhang et al.
Conflict of interest statement
The authors declare there are no competing interests.
Figures
Similar articles
-
Red Cell Distribution Width to Platelet Ratio Is Associated with Increasing In-Hospital Mortality in Critically Ill Patients with Acute Kidney Injury.Dis Markers. 2022 Jan 17;2022:4802702. doi: 10.1155/2022/4802702. eCollection 2022. Dis Markers. 2022. PMID: 35082929 Free PMC article.
-
Diagnostic value of red blood cell distribution width, platelet distribution width, and red blood cell distribution width to platelet ratio in children with hemophagocytic lymphohistiocytosis.J Clin Lab Anal. 2021 Sep;35(9):e23909. doi: 10.1002/jcla.23909. Epub 2021 Jul 17. J Clin Lab Anal. 2021. PMID: 34273201 Free PMC article.
-
Association of Red Cell Distribution Width-to-Platelet Ratio and Mortality in Patients with Sepsis.Mediators Inflamm. 2022 Sep 27;2022:4915887. doi: 10.1155/2022/4915887. eCollection 2022. Mediators Inflamm. 2022. PMID: 36204660 Free PMC article.
-
Diagnostic accuracy of red blood cell distribution width to platelet ratio for predicting staging liver fibrosis in chronic liver disease patients: A systematic review and meta-analysis.Medicine (Baltimore). 2019 Apr;98(14):e15096. doi: 10.1097/MD.0000000000015096. Medicine (Baltimore). 2019. PMID: 30946368 Free PMC article.
-
Prior Percutaneous Coronary Intervention and Mortality in Patients Undergoing Surgical Myocardial Revascularization: Results From the E-CABG (European Multicenter Study on Coronary Artery Bypass Grafting) With a Systematic Review and Meta-Analysis.Circ Cardiovasc Interv. 2018 Feb;11(2):e005650. doi: 10.1161/CIRCINTERVENTIONS.117.005650. Circ Cardiovasc Interv. 2018. PMID: 29440275
References
-
- Baggen VJM, Van den Bosch AE, Van Kimmenade RR, Eindhoven JA, Witsenburg M, Cuypers J, Leebeek FWG, Boersma E, Roos-Hesselink JW. Red cell distribution width in adults with congenital heart disease: a worldwide available and low-cost predictor of cardiovascular events. International Journal of Cardiology. 2018;260:60–65. doi: 10.1016/j.ijcard.2018.02.118. - DOI - PubMed
-
- Bozorgi A, Khaki S, Mortazavi SH, Sadeghian S, Khoshnevis M, Tofighi S, Khaki A. Effect of baseline red blood cell distribution width on short- and intermediate-term mortality of patients under primary percutaneous coronary intervention: a survival analysis. Critical Pathways in Cardiology. 2016a;15(2):69–74. doi: 10.1097/HPC.0000000000000063. - DOI - PubMed
MeSH terms
LinkOut - more resources
Full Text Sources
Medical
