

Exploring the effect of the triglyceride-glucose index on bone metabolism in prepubertal children, a retrospective study: insights from traditional methods and machine-learning-based bone remodeling prediction
- PMID: 40416622
- PMCID: PMC12101447
- DOI: 10.7717/peerj.19483
Exploring the effect of the triglyceride-glucose index on bone metabolism in prepubertal children, a retrospective study: insights from traditional methods and machine-learning-based bone remodeling prediction
Abstract
Background: Childhood obesity poses a significant risk to bone health, but the impact of insulin resistance (IR) on bone metabolism in prepubertal children, as assessed by the triglyceride-glucose (TyG) index, remains underexplored. Bone turnover markers (BTMs) provide a non-invasive method for evaluating bone remodeling, but their relationship to obesity-related metabolic changes requires further study.
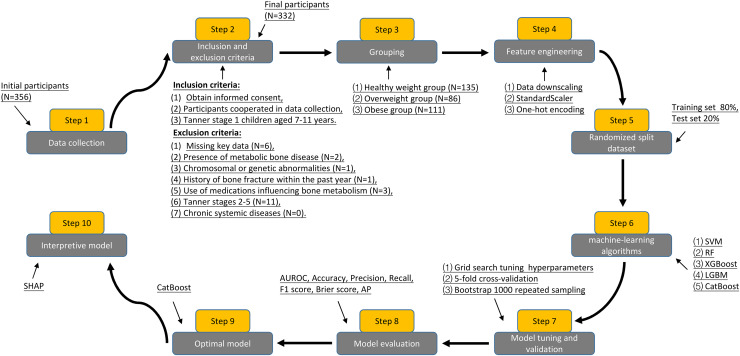
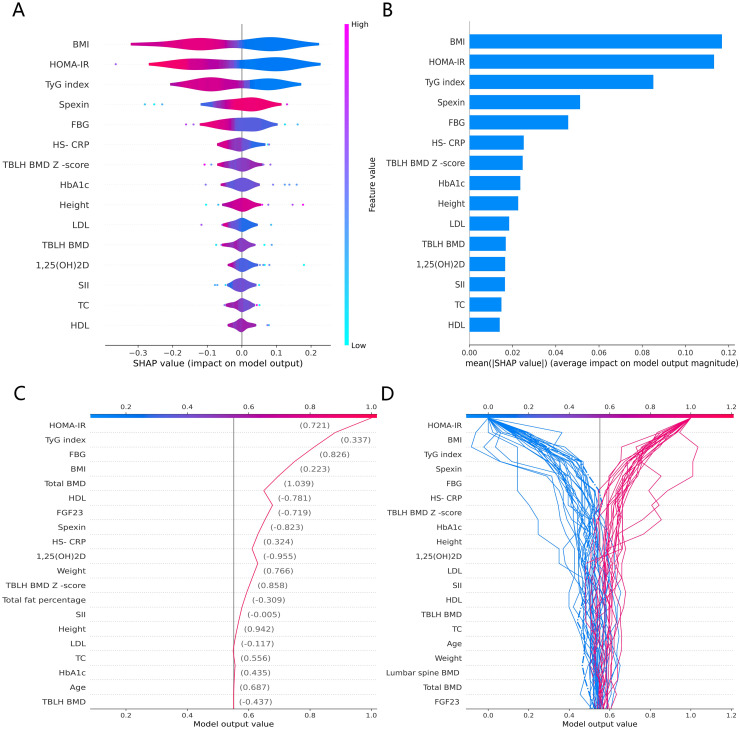
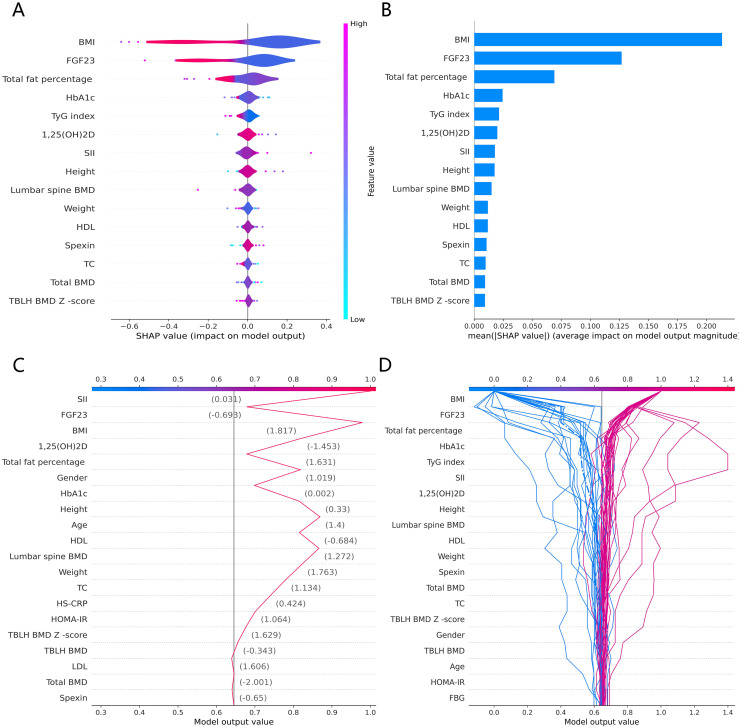
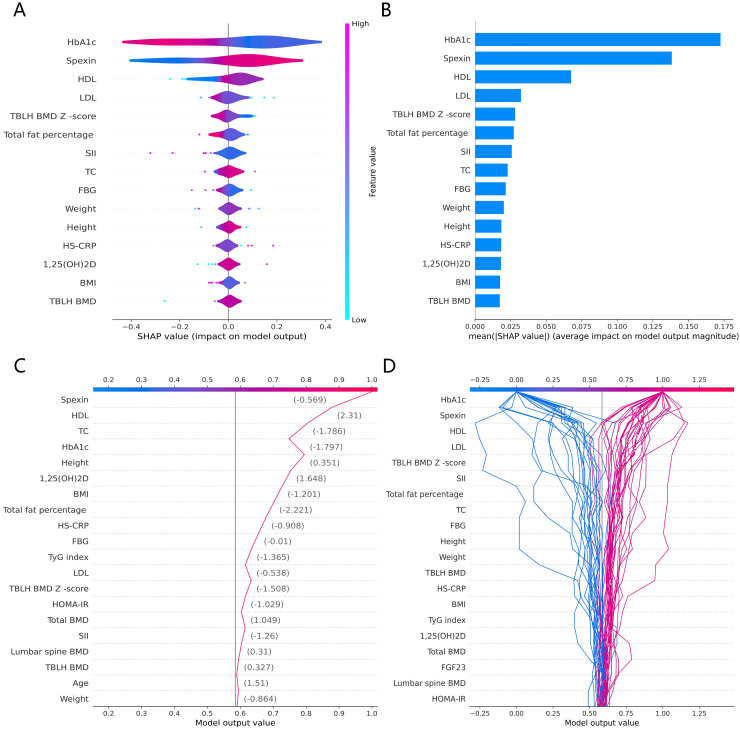
Methods: In this retrospective study of 332 prepubertal children (163 boys and 169 girls), we used multivariate linear regression and five machine learning (ML) algorithms to explore the association between the TyG index and BTMs, including β-C-terminal telopeptide of type 1 collagen (β-CTx), total procollagen type 1 N-terminal propeptide (T-P1NP), and N-terminal mid-fragment of osteocalcin (N-MID). The categorical boosting (CatBoost) models selected based on optimal performance metrics were interpreted using SHapley Additive exPlanation (SHAP) analysis to identify key features affecting prediction.
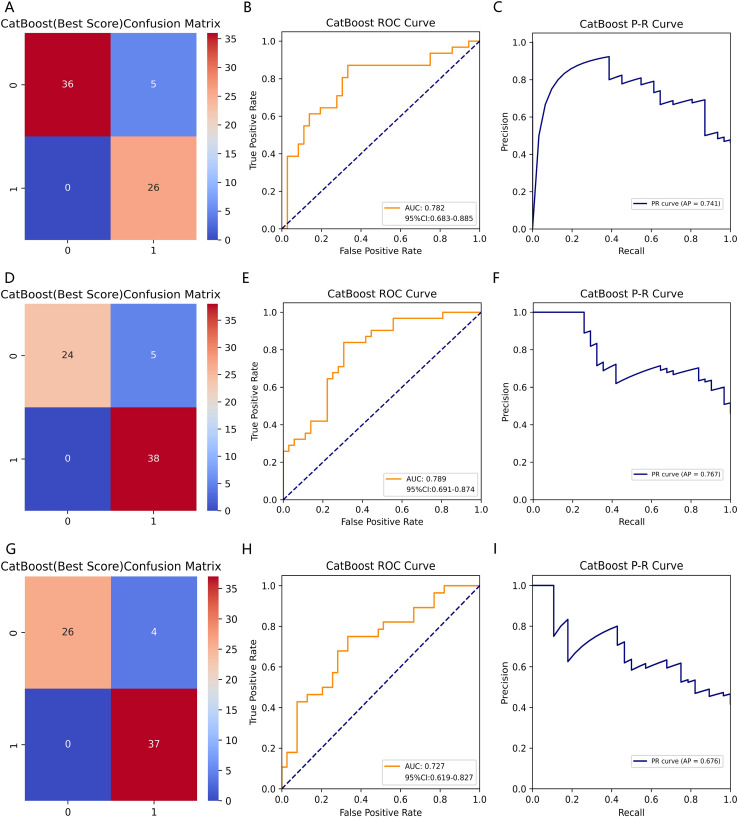
Results: The TyG index was negatively correlated with β-CTx, T-P1NP, and N-MID levels (P < 0.05), with a dose-response effect. The CatBoost model showed higher predictive accuracy and robustness, with the area under the receiver operating characteristic curve (AUROC) values of 0.782 (95% CI [0.68-0.885]), 0.789 (95% CI [0.691-0.874]), and 0.727 (95% CI [0.619-0.827]) for β-CTx, T-P1NP, and N-MID predictions, respectively. The SHAP analysis highlighted body mass index (BMI) and HbA1c as the key predictors.
Conclusions: The TyG index is a reliable predictor of bone metabolic disorders in prepubertal obese children, and the interpretable CatBoost model provides a cost-effective tool for early intervention. This study has important implications for prevention strategies for disorders of bone metabolism in prepubertal obese children to reduce the risk of skeletal fragility in adulthood or old age.
Keywords: Bone metabolism; Bone turnover markers; Machine learning; Prepubertal children; Triglyceride glucose index.
© 2025 Cao et al.
Conflict of interest statement
The authors declare that they have no competing interests.
Figures
References
-
- Abdollahian N, Ghazizadeh H, Mohammadi-Bajgiran M, Pashirzad M, Yaghooti Khorasani M, Bohn MK, Steele S, Roudi F, Kamel Khodabandeh A, Ghazi Zadeh S, Alami-Arani I, Badakhshan SN, Esmaily H, Ferns GA, Assaran-Darban R, Adeli K, Ghayour-Mobarhan M. Age-specific reference intervals for routine biochemical parameters in healthy neonates, infants, and young children in Iran. Journal of Cellular and Molecular Medicine. 2023;27(1):158–162. doi: 10.1111/jcmm.17646. - DOI - PMC - PubMed
-
- Aslan Çin NN, Yardımcı H, Koç N, Uçaktürk SA, Akçil Ok M. Triglycerides/high-density lipoprotein cholesterol is a predictor similar to the triglyceride-glucose index for the diagnosis of metabolic syndrome using International Diabetes Federation criteria of insulin resistance in obese adolescents: a cross-sectional study. Journal of Pediatric Endocrinology & Metabolism: JPEM. 2020;33(6):777–784. doi: 10.1515/jpem-2019-0310. - DOI - PubMed
-
- Badakhshan SN, Ghazizadeh H, Mohammadi-Bajgiran M, Esmaily H, Khorasani MY, Bohn MK, Pashirzad M, Khodabandeh AK, Zadeh SG, Alami-Arani I, Rahimi H, Ferns GA, Boskabadi H, Assaran-Darban R, Adeli K, Ghayour-Mobarhan M. Age-specific reference intervals for liver function tests in healthy neonates, infants, and young children in Iran. Journal of Clinical Laboratory Analysis. 2023;37(23–24):e24995. doi: 10.1002/jcla.24995. - DOI - PMC - PubMed
MeSH terms
Substances
LinkOut - more resources
Full Text Sources
Medical
