

Detecting sources of anger in automated driving: driving-related and external factor
- PMID: 40417070
- PMCID: PMC12098279
- DOI: 10.3389/fnrgo.2025.1548861
Detecting sources of anger in automated driving: driving-related and external factor
Abstract
Introduction: Anger while driving is often provoked by on-road events like sudden cut-offs but can also arise from external factors, such as rumination of negative thoughts. With the rise of autonomous vehicles, drivers are expected to engage more in non-driving activities, potentially increasing the occurrence of anger stemming from non-driving-related sources. Given the well-established link between anger and aggressive driving behaviors, it is crucial to detect and understand the various origins of anger in autonomous driving contexts to enhance road safety.
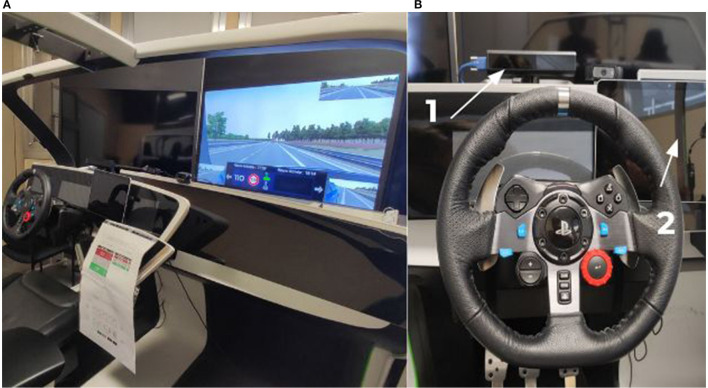
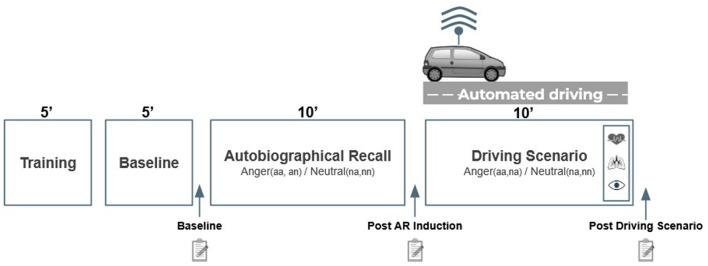
Methods: This study investigates whether physiological (cardiac and respiratory activities) and ocular indicators of anger vary depending on its source (driving-related or external) in a simulated autonomous driving environment. Using a combination of autobiographical recall (AR) for external anger induction and driving-related scenarios (DS), 47 participants were exposed to anger and/or neutral conditions across four groups.
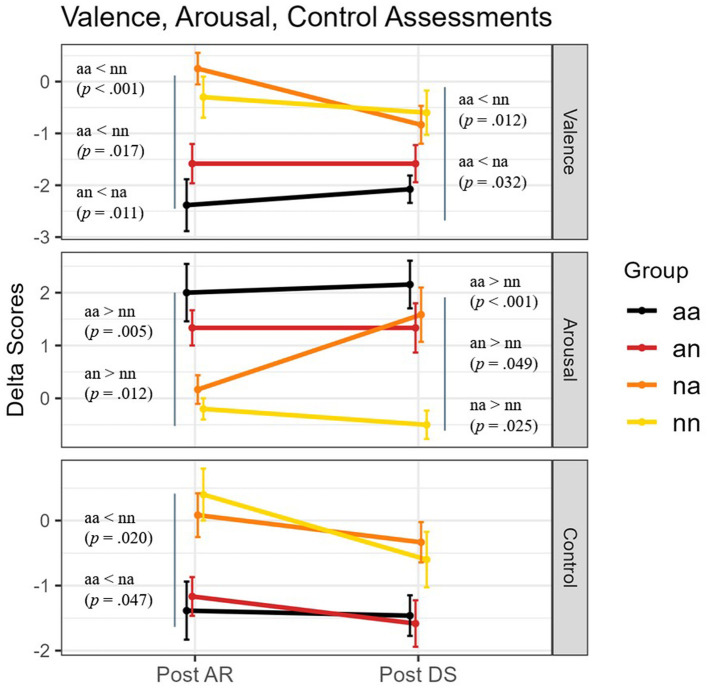
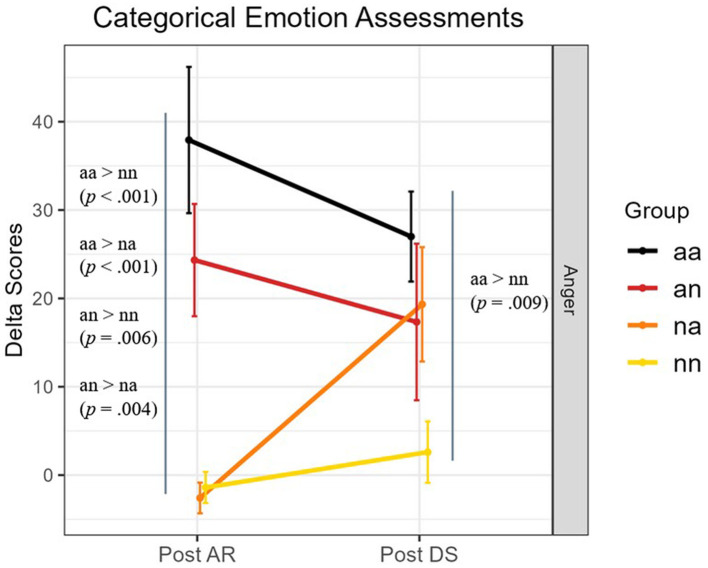
Results: The results revealed that combined anger induction (incorporating both external and driving-related sources) led to higher subjective anger ratings, more heart rate variability. However, when examined separately, individual anger sources did not produce significant differences in physiological responses and ocular strategies.
Discussion: These results suggest that the combination of anger-inducing events, rather than the specific source, is more likely to provoke a heightened state of anger. Consequently, future research should employ combined induction methods to effectively elicit anger in experimental settings. Moreover, anger detection systems should focus on the overall interplay of contributing factors rather than distinguishing between individual sources, as it is this cumulative dynamic that more effectively triggers significant anger responses.
Keywords: anger detection; anger sources; automated driving; ocular behavior; physiological indicators; subjective evaluations.
Copyright © 2025 Maillant, Jallais and Dabic.
Conflict of interest statement
The authors declare that the research was conducted in the absence of any commercial or financial relationships that could be construed as a potential conflict of interest.
Figures
Similar articles
-
The role of anger rumination as a mediator in the relationship between driver moral disengagement and driving angry.Heliyon. 2024 Apr 5;10(8):e29112. doi: 10.1016/j.heliyon.2024.e29112. eCollection 2024 Apr 30. Heliyon. 2024. PMID: 38644810 Free PMC article.
-
Detecting event-related driving anger with facial features captured by smartphones.Ergonomics. 2024 Oct 22:1-20. doi: 10.1080/00140139.2024.2418303. Online ahead of print. Ergonomics. 2024. PMID: 39436833
-
Exploring driving anger-caused impairment of takeover performance among professional taxi drivers during partially automated driving.Accid Anal Prev. 2024 Sep;205:107686. doi: 10.1016/j.aap.2024.107686. Epub 2024 Jun 22. Accid Anal Prev. 2024. PMID: 38909484
-
Work Environment, Stress, and Driving Anger: A Structural Equation Model for Predicting Traffic Sanctions of Public Transport Drivers.Int J Environ Res Public Health. 2018 Mar 12;15(3):497. doi: 10.3390/ijerph15030497. Int J Environ Res Public Health. 2018. PMID: 29534530 Free PMC article.
-
Mindfulness decreases driving anger expression: The mediating effect of driving anger and anger rumination.Accid Anal Prev. 2024 Aug;203:107642. doi: 10.1016/j.aap.2024.107642. Epub 2024 May 23. Accid Anal Prev. 2024. PMID: 38788434
References
-
- Alsaid A., Lee J. D., Noejovich S. I., Chehade A. (2023). The effect of vehicle automation styles on drivers' emotional state. IEEE Trans. Intelligent Transp. Syst. 24, 3963–3973. 10.1109/TITS.2023.3239880 - DOI
-
- Bosch E., Ihme K., Drewitz U., Jipp M., Oehl M. (2020). Why drivers are frustrated: results from a diary study and focus groups. Eur. Transp. Res. Rev. 12:52. 10.1186/s12544-020-00441-7 - DOI
LinkOut - more resources
Full Text Sources
Research Materials