. 2025 May 9:13:1513163.
doi: 10.3389/fcell.2025.1513163. eCollection 2025.

Characterization and neurogenic responses of primary and immortalized Müller glia

Affiliations

Characterization and neurogenic responses of primary and immortalized Müller glia

Thi-Hang Tran et al. Front Cell Dev Biol. .

Abstract

Primary Müller glia (MG) have been reported to exhibit a neurogenic capacity induced by small molecules. However, whether immortalized mouse MG cell lines exhibit neurogenic capacities similar to those of primary mouse MG remains unclear. In this study, we examined the morphology, proliferation rate, and marker profile of primary MG cells isolated from postnatal mouse pups with two immortalized mouse MG cell lines, QMMuC-1 and ImM10, in a standard growth medium. After chemical induction, we compared the morphology, markers, direct neuronal reprogramming efficiency, and axon length of these cell types in two culture media: Neurobasal and DMEM/F12. Our results showed that in standard growth medium, QMMuC-1 and ImM10 cells displayed similar morphology and marker profiles as primary MG cells, with the only differences observed in nestin expression. However, QMMuC-1 and ImM10 cells exhibited much higher proliferation rates than the primary MG cells. Following chemical treatment in both Neurobasal and DMEM/F12 media, a subset of primary MG, QMMuC-1, and ImM10 cells was induced to differentiate into immature neuron-like cells by day 7. While primary MG cells showed similar neuronal reprogramming efficiency and axon length extension in both media, QMMuC-1 and ImM10 cells displayed variations between the two culture media. Moreover, some of the induced neuronal cells derived from primary MG cells expressed HuC/D and Calbindin markers, whereas none of the cells derived from QMMuC-1 and ImM10 cells expressed these markers. Subsequent observations revealed that induced immature neuron-like cells derived from primary MG cells in both types of media and those derived from ImM10 cells cultured in DMEM/F12 survived until day 14. Taken together, our findings suggest that the two immortalized cell lines, QMMuC-1 and ImM10, exhibited neurogenic capacities similar to those of primary MG cells to some extent but did not fully recapitulate all their characteristics. Therefore, careful consideration should be given to culture conditions and the validation of key results when using immortalized cells as a substitute for primary MG cells.

Keywords: ImM10 cell line; Müller glia; QMMuC-1 cell line; chemical induction; neurogenic responses; neuronal reprogramming.


Conflict of interest statement

The authors declare that the research was conducted in the absence of any commercial or financial relationships that could be construed as a potential conflict of interest.

Figures

FIGURE 1
FIGURE 1
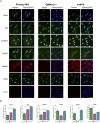
Morphology and proliferation rate of primary MG, QMMuC-1, and ImM10 cells in growth media. (A) The cellular morphology of primary MG, QMMuC-1, and ImM10 cells was observed under light microscopy. Scale Bars, 50 μm. (B) The proliferation rate of primary MG, QMMuC-1, and ImM10 cells in growth media for 7 days. Both immortalized cell lines exhibited a higher proliferation rate than primary MG. Error bars show mean ± SD.
FIGURE 2
FIGURE 2
Marker profile of primary MG, QMMuC-1, and ImM10 cells in growth media. (A) Representative images of primary MG, QMMuC-1, and ImM10 cells stained with MG markers (Sox9, GS, GLAST, and GFAP), retinal progenitor markers (nestin, Pax6), and a neuronal marker (TuJ1). Scale Bars, 50 μm. (B) The fluorescence intensity ratio for each marker. The data are presented as mean ± SD.
FIGURE 3
FIGURE 3
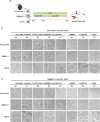
Morphological changes of primary MG, QMMuC-1, and ImM10 cells after chemical treatment. (A) The scheme of the chemical induction procedure. Primary MG, QMMuC-1, and ImM10 cells were seeded onto matrigel-coated wells and then cultured with an induction medium consisting of db-cAMP (D, 100 μM), Forskolin (F, 10 μM), Y-27632 (Y, 5 μM), ISX9 (I, 40 μM), CHIR99021 (C, 20 μM), and I-BET151 (B, 2 μM). After 2 days, the concentrations of three compounds were reduced (ISX9, 20 μM; CHIR99021, 3 μM; I-BET151, 1 μM). (B) Phase-contrast images of cells on days 0, 1, 3, 5, and 7 in a Neurobasal medium supplemented with 6 small molecules and the phase-contrast images of cells on days 7 in a Neurobasal medium supplemented with DMSO or only I-BET151 or only ISX9. (C) Phase-contrast images of cells on days 0, 1, 3, 5, and 7 in DMEM/F12 medium and the phase-contrast images of cells on days 7 in a DMEM/F12 medium supplemented with DMSO or only I-BET151 or only ISX9. Primary MG, QMMuC-1, and ImM10 cells changed their cell shape from glial morphology to neuron-like morphology during the chemical induction process in both media supplemented with 6 compounds. Scale Bars, 25 μm.
FIGURE 4
FIGURE 4
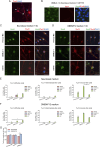
Analysis of TuJ1-positive cells derived from primary MG, QMMuC-1, and ImM10 cells at day 7 after chemical treatment. (A) Representative images of three morphologically distinct types of TuJ1+ cells derived from primary MG at day 7. TuJ1+ cell with neuron-like morphology is indicated by a white arrowhead. TuJ1+ cell with intermediate-like morphology is indicated by a white arrow. TuJ1+ cell with MG-like morphology is indicated by a blue arrow. Scale bars, 100 μm. (B) A representative image of cells in the control group that were not induced into TuJ1+ cells: QMMuC-1 cells cultured in Neurobasal medium supplemented with I-BET151 only. Scale bars, 50 μm. (C, D) Immunostaining of primary MG, QMMuC-1, and ImM10 cells with TuJ1 and Sox9 markers at day 7 in Neurobasal medium (C) and DMEM/F12 medium (D). Scale bars, 50 μm. (E–F) The percentage of neuron-like morphology/TuJ1+ cells, intermediate-like morphology/TuJ1+ cells, and MG-like morphology/TuJ1+ cells derived from primary MG, QMMuC-1, and ImM10 cells among total number of cells at day 7 in Neurobasal medium (E) and DMEM/F12 medium (F). The data are presented as mean ± SEM (n = 3). (G) The total axonal length per cell of neuron-like morphology/TuJ1+ cells at day 7. The data are presented as mean ± SEM (n = 3). 6C–Medium supplemented with 6 small molecules.
FIGURE 5
FIGURE 5
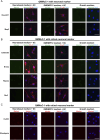
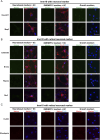
Immunostaining results of neuron-like cells derived from primary MG cells with various neuronal markers and retinal neuron markers. (A) Cells were stained with TuJ1 marker and neuronal markers: NeuroD1 and Map2. Scale Bars, 50 μm. (B) Cells were stained with TuJ1 marker and retinal neuron markers: Calbindin (primarily expressed in horizontal cell, as well as in some subtypes of amacrine and retinal ganglion cells); Brn3a and Rbpms (markers of retinal ganglion cells); Otx2 (marker of bipolar and immature photoreceptor). Scale Bars, 50 μm. (C) Cells were stained retinal neuron markers: HuC/D (expressed in amacrine and retinal ganglion cells, with transient expression in horizontal cells during development), Rhodopsin (marker of mature rod photoreceptor). (D) The percentage of cells derived from primary MG that were positive for Calbindin/TuJ1 or HuC/D among total cells on day 7. The data are presented as mean ± SD (n = 3). Scale Bars, 50 μm. 6C–Medium supplemented with 6 small molecules.
FIGURE 6
FIGURE 6
Immunostaining results of neuron-like cells derived from QMMuC-1 cells with various neuronal markers and retinal neuron markers. (A) Cells were stained with TuJ1 marker and neuronal markers: NeuroD1 and Map2. Scale Bars, 50 μm. (B) Cells were stained with TuJ1 marker and retinal neuron markers: Calbindin (primarily expressed in horizontal cell, as well as in some subtypes of amacrine and retinal ganglion cells); Brn3a and Rbpms (markers of retinal ganglion cells); Otx2 (marker of bipolar and immature photoreceptor). Scale Bars, 50 μm. (C) Cells were stained retinal neuron markers: HuC/D (expressed in amacrine and retinal ganglion cells, with transient expression in horizontal cells during development), Rhodopsin (marker of mature rod photoreceptor). Scale Bars, 50 μm. 6C–Medium supplemented with 6 small molecules.
FIGURE 7
FIGURE 7
Immunostaining results of neuron-like cells derived from ImM10 cells with various neuronal markers and retinal neuron markers. (A) Cells were stained with TuJ1 marker and neuronal markers: NeuroD1 and Map2. Scale Bars, 50 μm. (B) Cells were stained with TuJ1 marker and retinal neuron markers: Calbindin (primarily expressed in horizontal cell, as well as in some subtypes of amacrine and retinal ganglion cells); Brn3a and Rbpms (markers of retinal ganglion cells); Otx2 (marker of bipolar and immature photoreceptor). Scale Bars, 50 μm. (C) Cells were stained retinal neuron markers: HuC/D (expressed in amacrine and retinal ganglion cells, with transient expression in horizontal cells during development), Rhodopsin (marker of mature rod photoreceptor). Scale Bars, 50 μm. 6C–Medium supplemented with 6 small molecules.
FIGURE 8
FIGURE 8
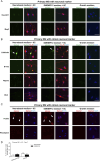
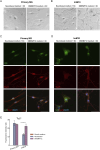
Morphology and immunocytochemistry staining of primary MG and ImM10 cells at day 14 after chemical induction. (A) Morphology of primary MG cells at day 14 in Neurobasal and DMEM/F12 media. Scale Bars, 50 μm. (B) Morphology of ImM10 cells at day 14 in Neurobasal and DMEM/F12 media. Scale Bars, 50 μm. Primary MG (C) and ImM10 cells (D) were stained with GS and TuJ1 markers at day 14 post-chemical treatment. Scale Bars, 50 μm (E) The fluorescence intensity ratio for TuJ1 marker. 6C–Medium supplemented with 6 small molecules.

Similar articles

References

    1. Amand M. M., Hanover J. A., Shiloach J. (2016). A comparison of strategies for immortalizing mouse embryonic fibroblasts. J. Biol. Methods 3, e41. 10.14440/jbm.2016.110 - DOI - PMC - PubMed
    1. Arshadi C., Günther U., Eddison M., Harrington K. I. S., Ferreira T. A. (2021). SNT: a unifying toolbox for quantification of neuronal anatomy. Nat. Methods 18, 374–377. 10.1038/s41592-021-01105-7 - DOI - PubMed
    1. Augustine J., Pavlou S., O’hare M., Harkin K., Stitt A., Curtis T., et al. (2018). Characterization of a spontaneously immortalized murine müller glial cell line QMMuC-1. Invest. Ophthalmol. Vis. Sci. 59, 1666–1674. 10.1167/iovs.17-23293 - DOI - PubMed
    1. Cho J.-H., Tsai M.-J. (2004). The role of BETA2/NeuroD1 in the development of the nervous system. Mol. Neurobiol. 30, 035–047. 10.1385/MN:30:1:035 - DOI - PubMed
    1. Coco-Martin R. M., Pastor-Idoate S., Pastor J. C. (2021). Cell replacement therapy for retinal and optic nerve diseases: cell sources, clinical trials and challenges. Pharmaceutics 13, 865. 10.3390/pharmaceutics13060865 - DOI - PMC - PubMed

LinkOut - more resources