. 2025 May 9:16:1565422.
doi: 10.3389/fphar.2025.1565422. eCollection 2025.

Suppressing chondrocyte cuproptosis by syringaresinol-4- O- β-d-glucoside alleviates gouty arthritis

Affiliations

Suppressing chondrocyte cuproptosis by syringaresinol-4- O- β-d-glucoside alleviates gouty arthritis

Shaotian Fu et al. Front Pharmacol. .

Abstract

Background: Gouty arthritis is a rheumatic disease characterized by synovial inflammation and cartilage damage. Current therapeutic options for gouty arthritis, such as colchicine, primarily relieve the symptoms, which makes treatment challenging.

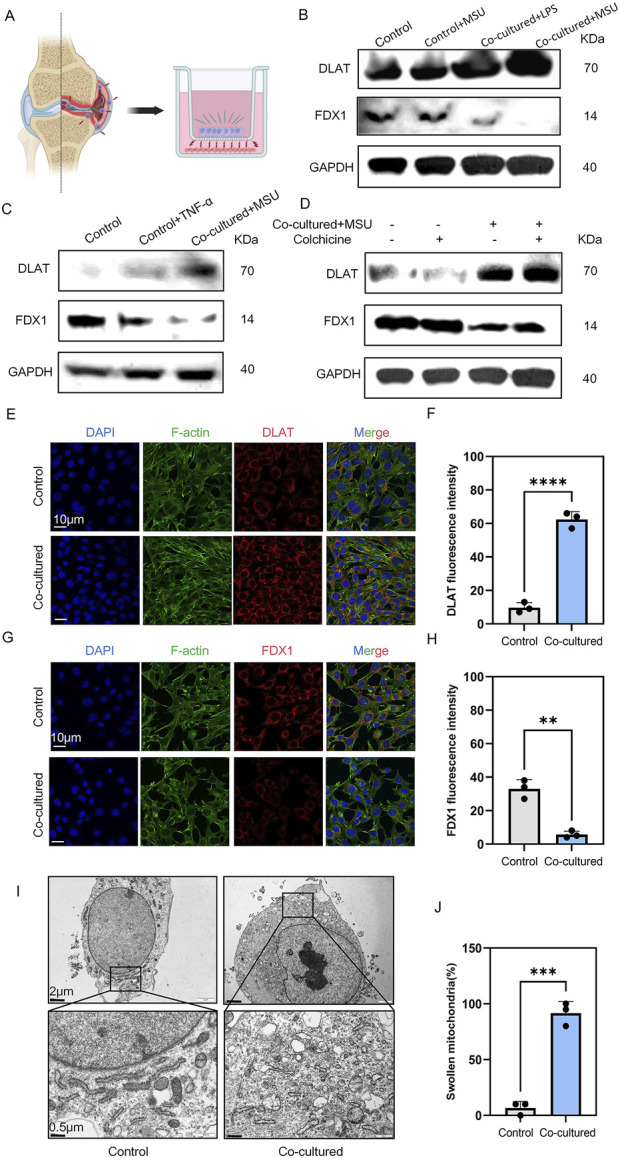
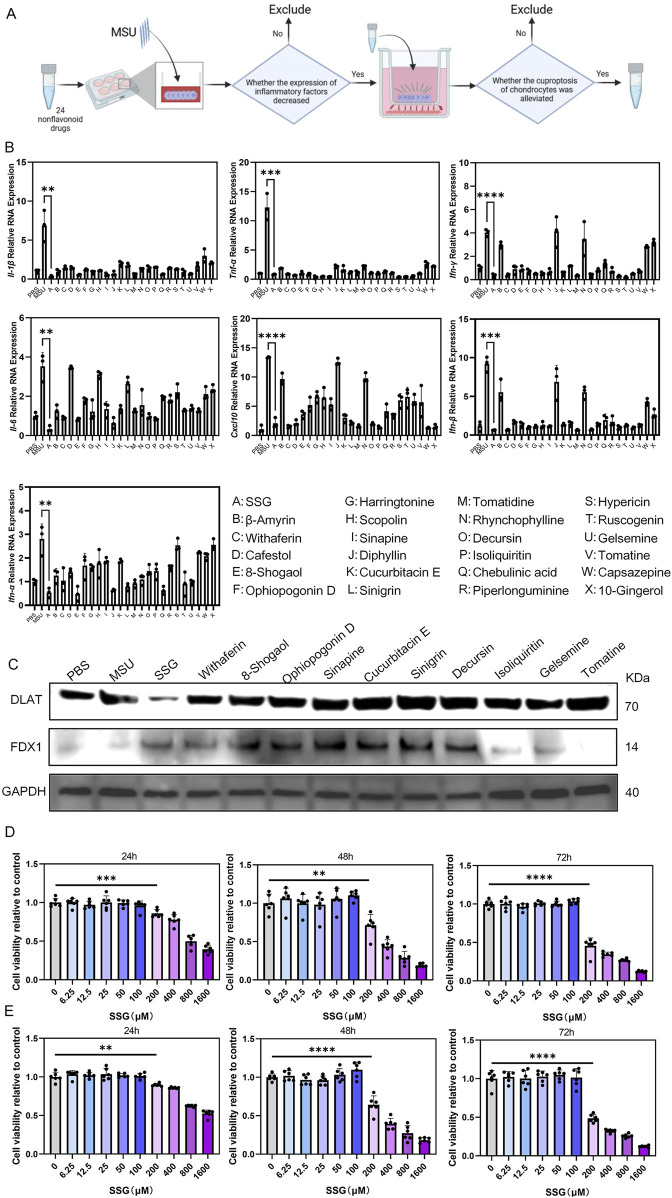
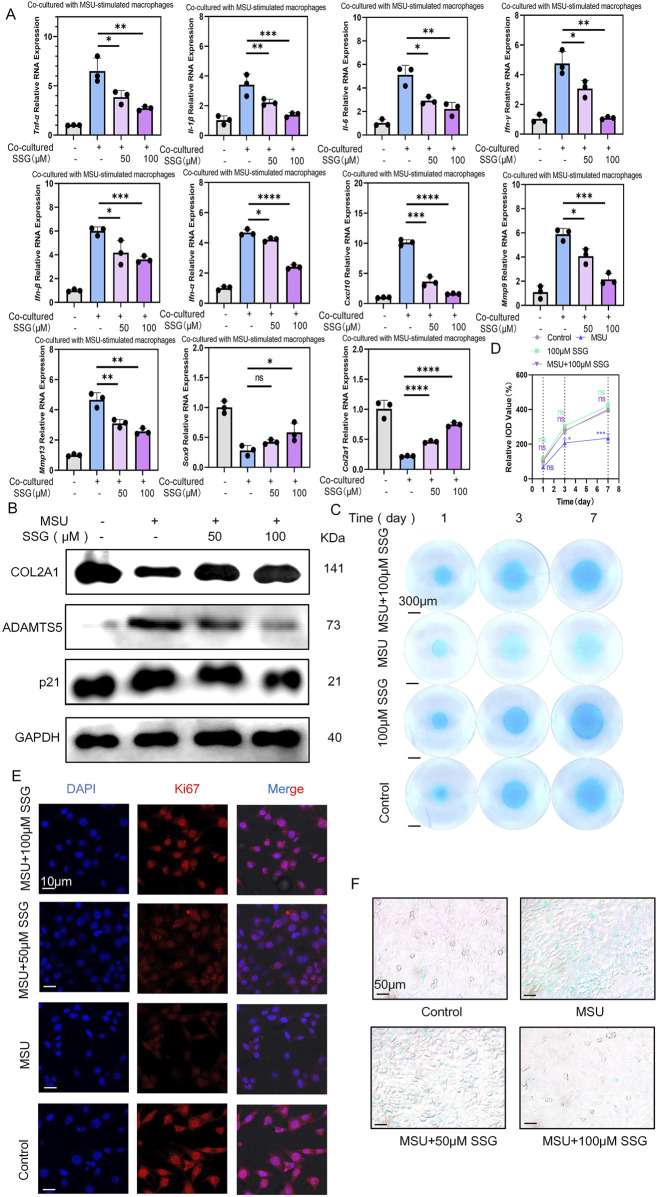
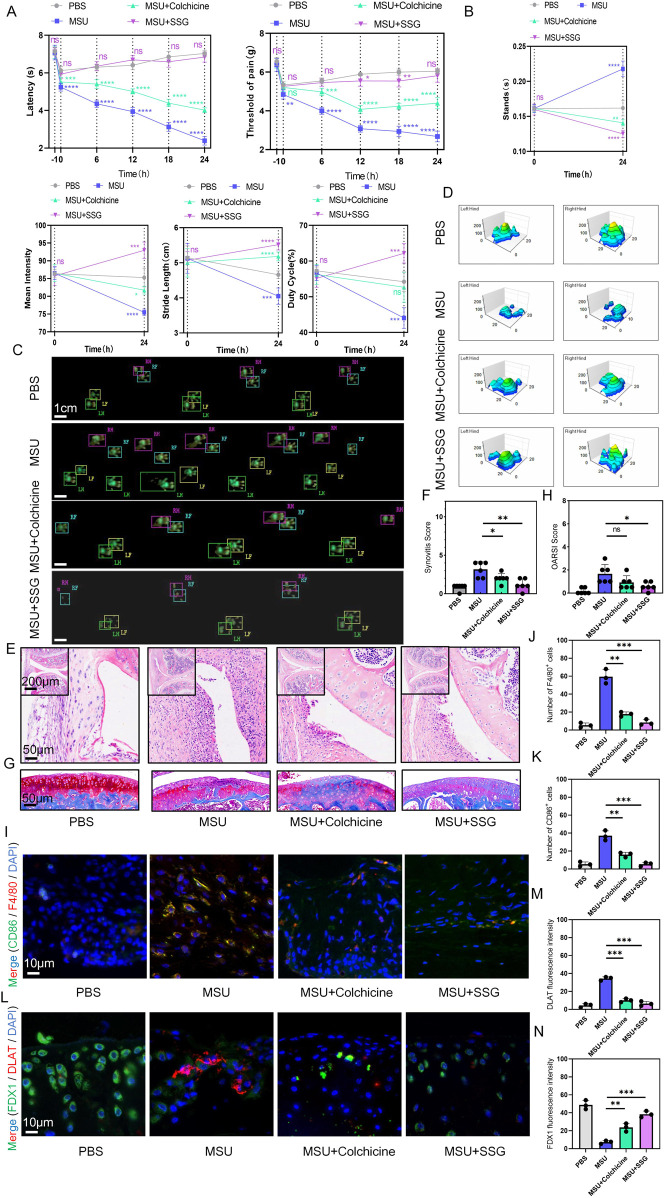
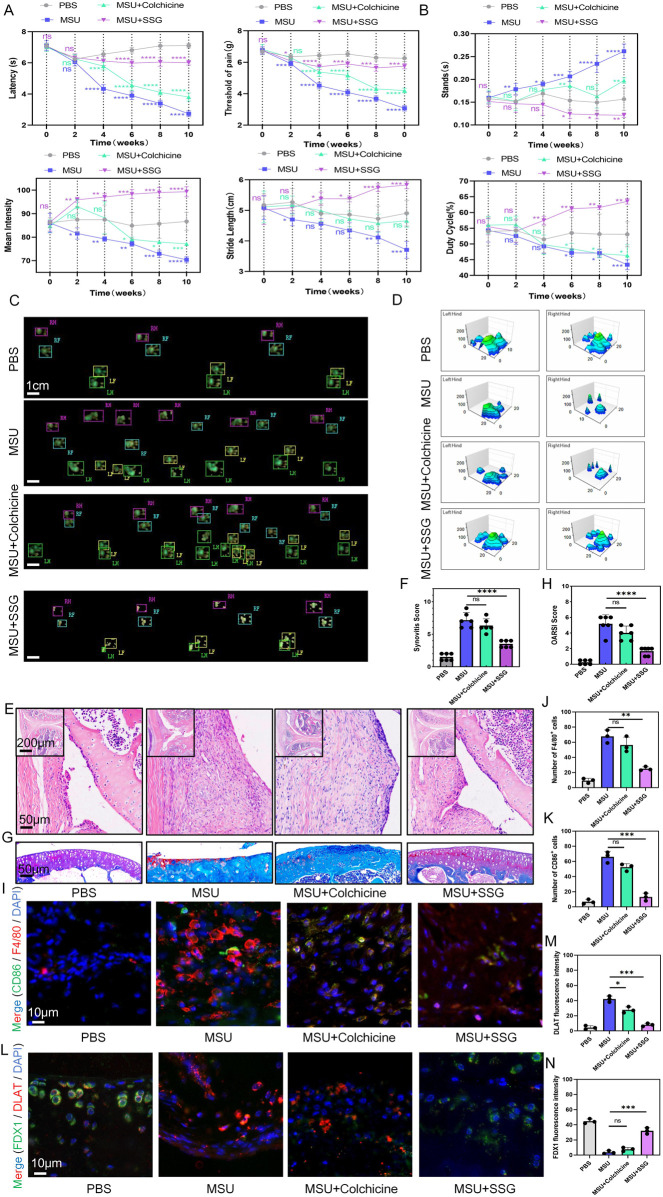
Methods: We employed an in vitro co-culture system of chondrocytes and macrophages to simulate gouty arthritis and screen compounds that can inhibit monosodium urate (MSU) associated macrophage inflammation and chondrocytes degeneration. We further elucidated the cuproptosis mechanism in chondrocytes by qPCR and Western blotting analyses. Both acute and chronic gouty arthritis mouse models were established to evaluate the therapeutic efficacy of candidate drugs against gouty arthritis.

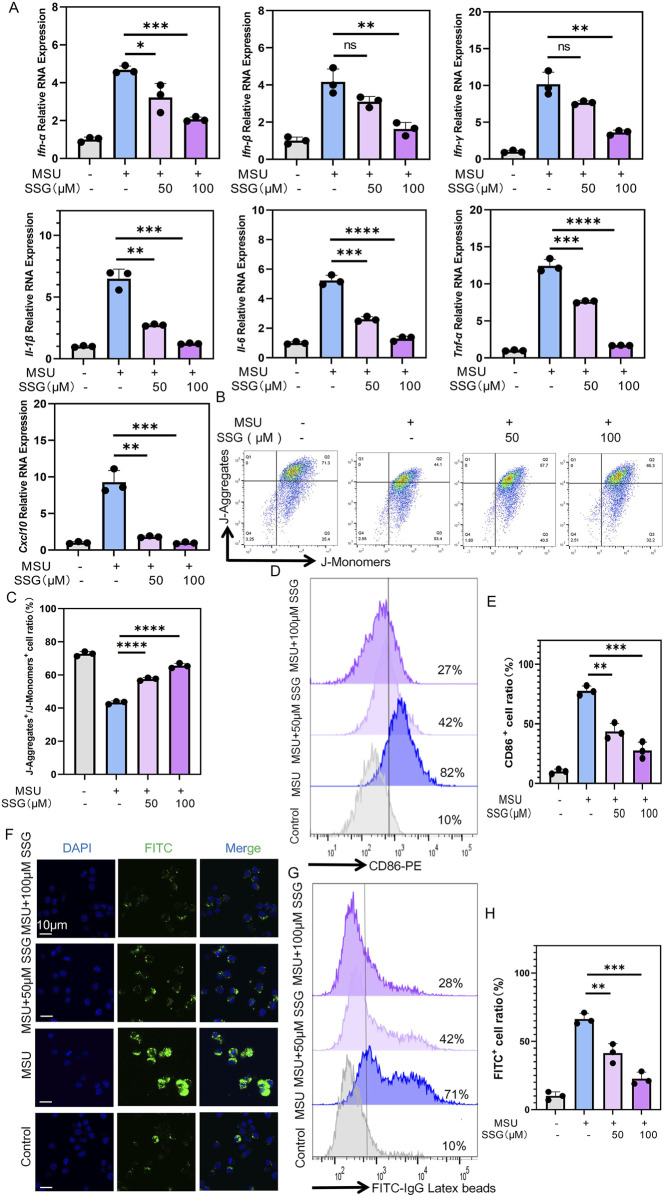
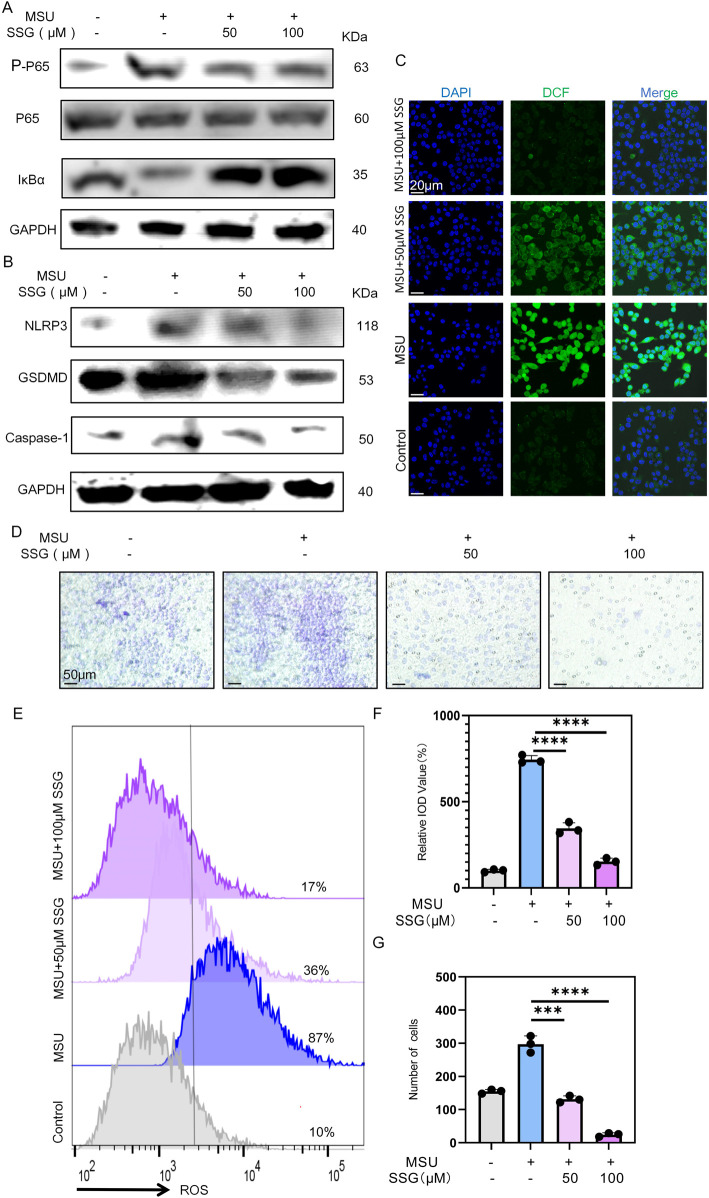
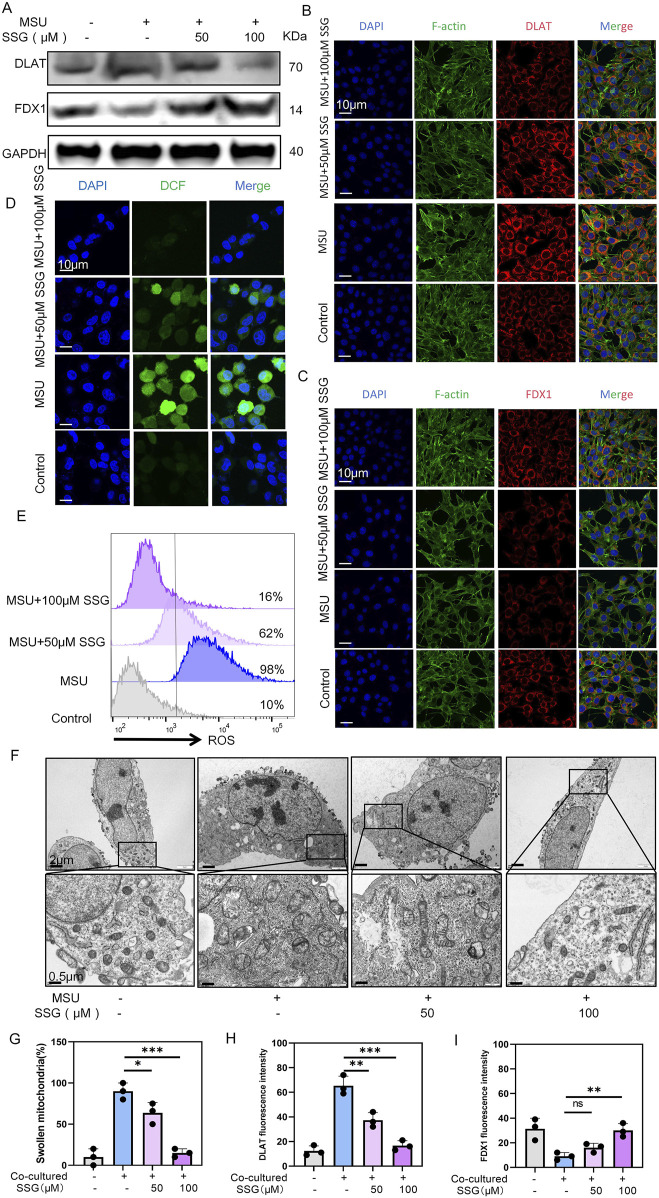
Results: MSU upregulates the expression of inflammatory cytokines in macrophages and simultaneously induces cuproptosis in chondrocytes. By screening 24 compounds, we identified syringaresinol-4-O-β-d-glucoside (SSG), a furanoid lignan, as a potent inhibitor of macrophage-mediated inflammation and chondrocyte cuproptosis. Mechanistically, SSG inhibited MSU-induced activation of the NF-κB and NLRP3 pathways in macrophages. Furthermore, SSG regulated the expression of sulfur-linked mitochondrial enzymes (e.g., DLAT) in the cuproptosis pathway, thereby inhibiting the upstream regulator FDX1 in chondrocytes. SSG not only alleviated inflammatory pain but also protected against cartilage damage and improved motor dysfunction in the mice models of acute and chronic gouty arthritis.

Conclusion: SSG can serve as a promising therapeutic option for gouty arthritis in clinical settings by suppressing inflammation and preserving cartilage integrity.

Keywords: chondrocyte; cuproptosis; gouty arthritis; inflammatory cytokines; monosodium urate crystals; syringaresinol-4-O-β-D-glucoside.


Conflict of interest statement

The authors declare that the research was conducted in the absence of any commercial or financial relationships that could be construed as a potential conflict of interest.

Figures

FIGURE 1
FIGURE 1
MSU-stimulated RAW264.7 co-cultured with ATDC5 resulted in ATDC5 cuproptosis. (A) co-culture strategy of chondrocytes and macrophages. (B–D) Western blot detection of DLAT and FDX1 protein expression. (E) Representative images of DLAT immunofluorescence. (F) Statistics of fluorescence intensity of DLAT, respectively (n = 3). (G) Representative images of FDX1 immunofluorescence. (H) Statistics of fluorescence intensity of FDX1, respectively (n = 3). (I) Representative scanning electron microscope images of chondrocytes. (J) Statistics of the proportion of swollen mitochondria in chondrocytes, respectively (n = 3). The bar graph represents the mean ± SD. *p < 0.05, **p < 0.01, ***p < 0.001 compared to the control group.
FIGURE 2
FIGURE 2
Drug screening in vitro confirmed that SSG could inhibit inflammation and resist cuproptosis of chondrocytes. (A) Flowchart of Drug Screening. (B) The gene expression levels of Il-1β, Il-6, Tnf-α, Ifn-α, Ifn-β, Ifn-γ and Cxcl10 were evaluated using RT-qPCR (n = 3). (C) Western blot detection of DLAT and FDX1 protein expression. (D) The CCK8 assay was used to assess the viability of OSC on RAW264.7 at specified time points (n = 6). (E) The CCK8 assay was used to assess the viability of OSC on ATDC5 at specified time points (n = 6). The bar graph represents the mean ± SD. *p < 0.05, **p < 0.01, ***p < 0.001 compared to the control group.
FIGURE 3
FIGURE 3
SSG inhibited the inflammatory phenotype of macrophages stimulated by MSU in a dose-dependent manner. (A) The gene expression levels of Il-1β, Il-6, Tnf-α, Ifn-α, Ifn-β, Ifn-γ and Cxcl10 were evaluated using RT-qPCR (n = 3). (B) JC-1 assay is used to detect changes in mitochondrial membrane potential in macrophages. (C) The ratio of J-Aggregate+/J-Monomer+ cells in panel B (n = 3). (D) Flow cytometry of CD86 marker in macrophages. (E) Quantifying CD86 labeled positive cells shown in panel D (n = 3). (F) Representative images of macrophages phagocytosing FITC-labeled particles. (G) Flow cytometry of FITC-labeled particles phagocytosed by macrophages. (H) Quantifying FITC labeled positive cells shown in panel G (n = 3). The bar graph represents the mean ± SD. *p < 0.05, **p < 0.01, ***p < 0.001 compared to the control group.
FIGURE 4
FIGURE 4
SSG inhibits the activation of NF-κB and NLRP3 pathways in MSU-stimulated macrophages and reduces the pro-inflammatory phenotype of macrophages. (A) The protein expression levels of IκBα, p65 and p-p65 were assessed by Western blot. (B) Western blot detection of GSDMD, Caspase1, NLRP3 protein expression. (C) Representative images of ROS fluorescence. (D) Use cell migration experiments to analyze macrophage chemotactic ability. (E) Flow cytometry of ROS marker in macrophages. (F) Quantifying relative IOD value (%) shown in panel C (n = 3). (G) Statistics of the number of migrating macrophages (n = 3). The bar graph represents the mean ± SD. *p < 0.05, **p < 0.01, ***p < 0.001 compared to the control group.
FIGURE 5
FIGURE 5
SSG alleviated the senescence and extracellular matrix degradation of ATDC5 co-cultured with MSU-stimulated RAW264.7 cells. (A) The gene expression levels of Il-1β, Il-6, Tnf-α, Ifn-α, Ifn-β, Ifn-γ, Cxcl10, Mmp-3, Mmp13, Sox9 and Col2a1 were evaluated using RT-qPCR (n = 3). (B) The protein expression of COL2A1, p21 and ADAMTS5 were assessed by Western blot. (C) Detection of extracellular matrix production capacity in high-density chondrocyte culture experiments at specified time points. (D) Quantifying relative IOD value (%) shown in panel C (n = 3). (E) Representative images of Ki67 expression in ATDC5. (F) β-gal staining experiment for detecting the degree of chondrocyte senescence. The bar graph represents the mean ± SD. *p < 0.05, **p < 0.01, ***p < 0.001 compared to the control group.
FIGURE 6
FIGURE 6
SSG reduces the cuproptosis of chondrocytes caused by MSU-induced release of inflammatory factors from macrophages. (A) Western blot detection of DLAT and FDX1 protein expression. (B) Representative images of DLAT immunofluorescence. (C) Representative images of FDX1 immunofluorescence. (D) Representative images of ROS fluorescence in chondrocytes. (E) Flow cytometry of ROS marker in chondrocytes. (F) Representative scanning electron microscope images of chondrocytes. (G) Statistics of the proportion of swollen mitochondria in chondrocytes, respectively (n = 3). (H,I) Statistics of fluorescence intensity of DLAT and FDX1, respectively (n = 3). The bar graph represents the mean ± SD. *p < 0.05, **p < 0.01, ***p < 0.001 compared to the control group.
FIGURE 7
FIGURE 7
SSG reduced movement disorders, synovial inflammatory cell infiltration and cartilage damage in acute gout mice. (A) Reflexive mechanical and thermal pain-related responses within 24 h after injection of MSU crystals (0.8 mg/site) into the knee joints of mice subjected to different treatments (n = 6). (B) Changes in the four indices of stands, mean intensity, stride length, and duty cycle in gait analysis of mice before and after the experiment (n = 6). (C) Footprint impression diagram for mouse gait analysis. (D) Schematic diagram of the maximum pressure on the left and right hind limbs of mice. (E,F) Representative H&E stained images of mouse synovium and statistical analysis of synovial swelling index (n = 6). (G,H) Representative images of mouse joint sections stained with Safranin-O-Fast Green and statistical analysis of articular cartilage damage index (n = 6). (I–K) Representative images of double immunohistochemical staining for F4/80 and CD86 in mouse synovium and statistical analysis of the number of cells positive for both markers (n = 3). (L–N) Representative images of double immunohistochemical staining for DLAT and FDX1 in mouse articular cartilage and statistical analysis of the fluorescence intensity for both markers (n = 3). The bar graph represents the mean ± SD. *p < 0.05, **p < 0.01, ***p < 0.001 compared to the control group.
FIGURE 8
FIGURE 8
SSG reduced dyskinesia, synovial inflammatory cell infiltration, and cuproptosis of chondrocyte in gouty arthritis mice. (A) Administer repeated knee joint injections of MSU and drug treatment to mice over a period of 10 weeks, and record reflexive mechanical and thermal pain-related responses every 2 weeks (n = 6). (B) Perform gait analysis on mice every 2 weeks over a 10-week period, and record and analyze the changes in the four indices: stands, mean intensity, stride length, and duty cycle. (C) Footprint impression diagram from gait analysis of mice after 10 weeks. (D) Schematic diagram of the maximum pressure on the left and right hind limbs of mice after 10 weeks. (E,F) Representative H&E-stained images of mouse synovium, accompanied by statistical analysis of the synovial swelling index (n = 6). (G,H) Representative images of mouse joint sections stained with Safranin-O-Fast Green, along with statistical analysis of the articular cartilage damage index (n = 6). (I–K) Representative images of double immunohistochemical staining for F4/80 and CD86 in mouse synovium, including statistical analysis of the number of cells positive for both markers (n = 3). (L–N) Representative images of double immunohistochemical staining for DLAT and FDX1 in mouse articular cartilage, with statistical analysis of the fluorescence intensity for both markers provided (n = 3). The bar graph represents the mean ± SD. *p < 0.05, **p < 0.01, ***p < 0.001 compared to the control group.

Similar articles

References

    1. Anderson I. J., Davis A. M., Jan R. H. (2021). Management of Gout. JAMA 326, 2519–2520. 10.1001/jama.2021.19763 - DOI - PubMed
    1. Cabău G., Crișan T. O., Klück V., Popp R. A., Joosten L. A. B. (2020). Urate-induced immune programming: consequences for gouty arthritis and hyperuricemia. Immunol. Rev. 294, 92–105. 10.1111/imr.12833 - DOI - PMC - PubMed
    1. Chen L., Min J., Wang F. (2022). Copper homeostasis and cuproptosis in health and disease. Signal Transduct. Target Ther. 7, 378. 10.1038/s41392-022-01229-y - DOI - PMC - PubMed
    1. Chen Z., Li Y. Y., Liu X. (2023). Copper homeostasis and copper-induced cell death: novel targeting for intervention in the pathogenesis of vascular aging. Biomed. Pharmacother. 169, 115839. 10.1016/j.biopha.2023.115839 - DOI - PubMed
    1. Cleophas M. C., Crişan T. O., Joosten L. A. (2017). Factors modulating the inflammatory response in acute gouty arthritis. Curr. Opin. Rheumatol. 29, 163–170. 10.1097/BOR.0000000000000366 - DOI - PubMed

LinkOut - more resources