

Expression and clinical significance of FANCI gene in pan-cancer: a comprehensive analysis based on multi-omics data
- PMID: 40417238
- PMCID: PMC12098372
- DOI: 10.3389/fgene.2025.1542888
Expression and clinical significance of FANCI gene in pan-cancer: a comprehensive analysis based on multi-omics data
Abstract
Introduction: The FANCI gene, an essential element of the Fanconi anemia pathway, has been associated with a variety of cancer types. This investigation seeks to clarify the expression profiles, prognostic relevance, and diagnostic capabilities of FANCI across multiple malignancies, along with its links to immune cell infiltration, genetic alterations, protein-protein interactions, and functional roles.
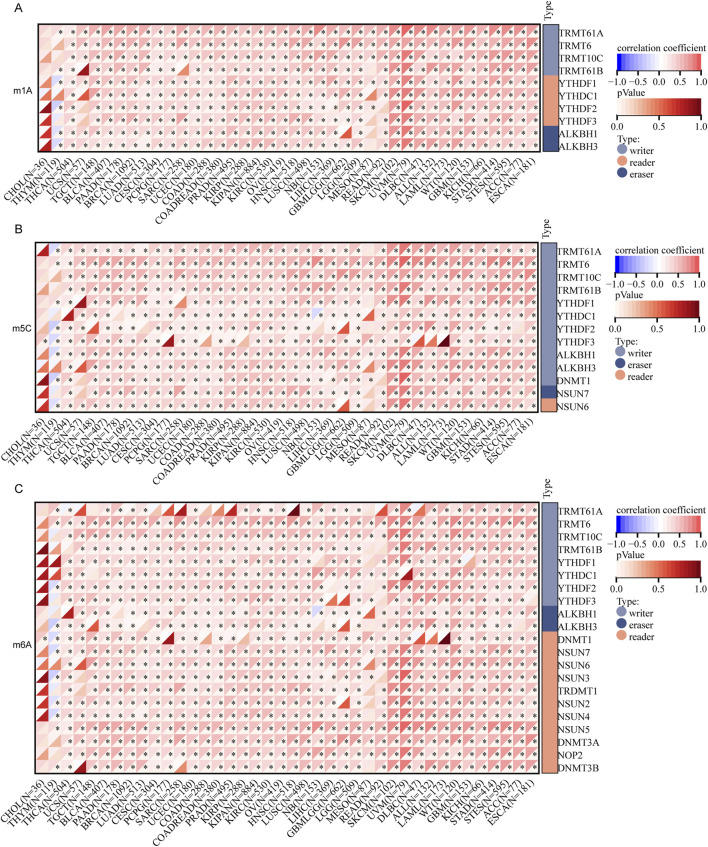
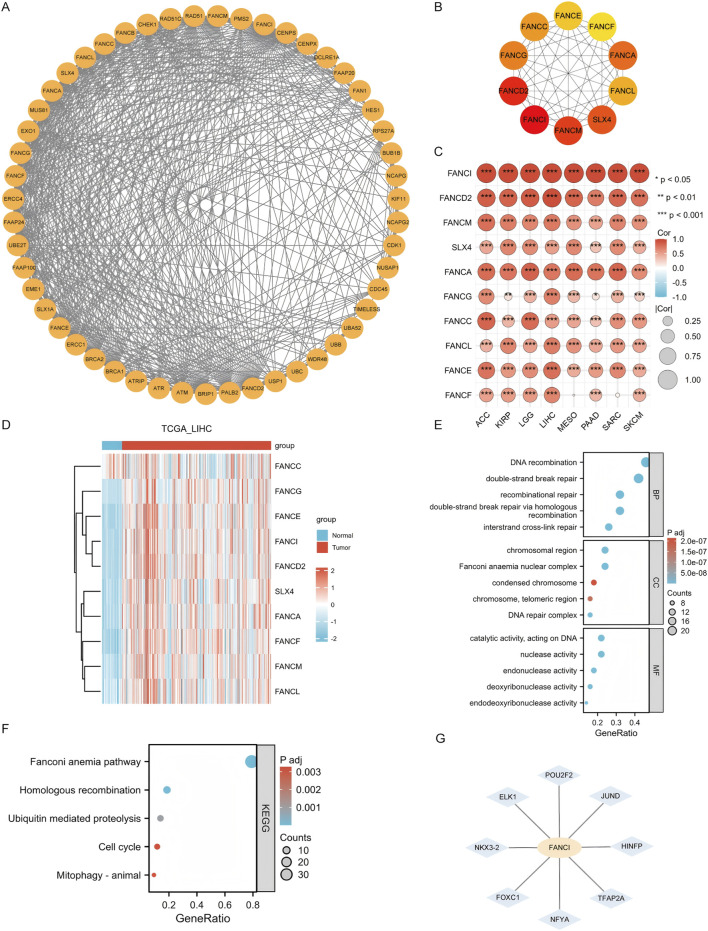
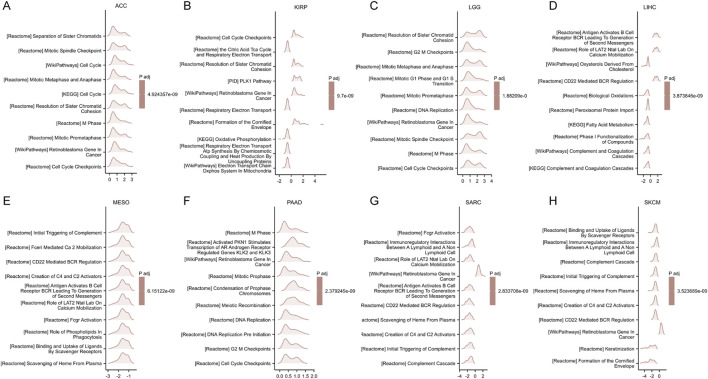
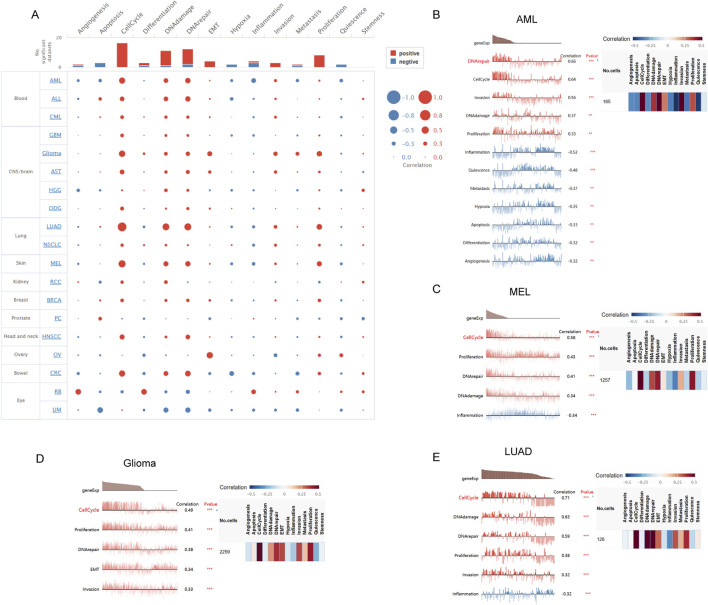
Methods: By utilizing data from The Cancer Genome Atlas (TCGA) and Genotype-Tissue Expression (GTEx) databases, we conducted a comprehensive analysis of FANCI mRNA expression using R software and visualized the results with the ggplot2 package. Prognostic and diagnostic evaluations were conducted using Xiantao tools to produce survival and receiver operating characteristic (ROC) curves. The examination of genetic variation was facilitated through cBioPortal, while DNA methylation and mRNA modifications were analyzed utilizing UALCAN and SangerBox 3.0. Correlations with immune responses were assessed via the EPIC platform and SangerBox 3.0. Additionally, we constructed protein-protein interaction networks employing the STRING database and Cytoscape software. Functional enrichment analyses encompassed Gene Ontology (GO), Kyoto Encyclopedia of Genes and Genomes (KEGG), and Gene Set Enrichment Analysis (GSEA). The CancerSEA database was also utilized for single-cell level investigation of FANCI's association with the functional states of cancer.
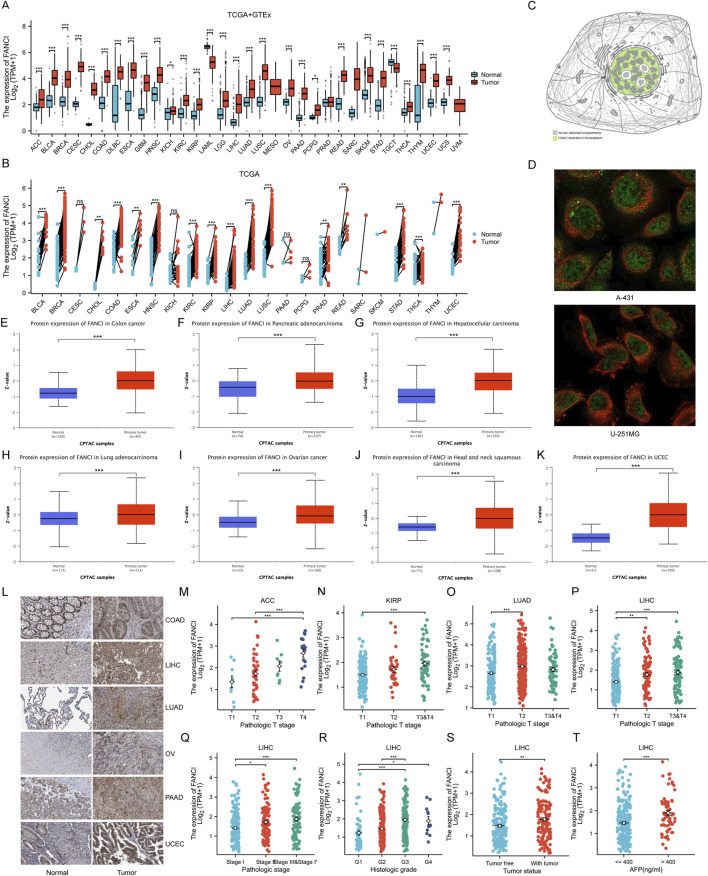
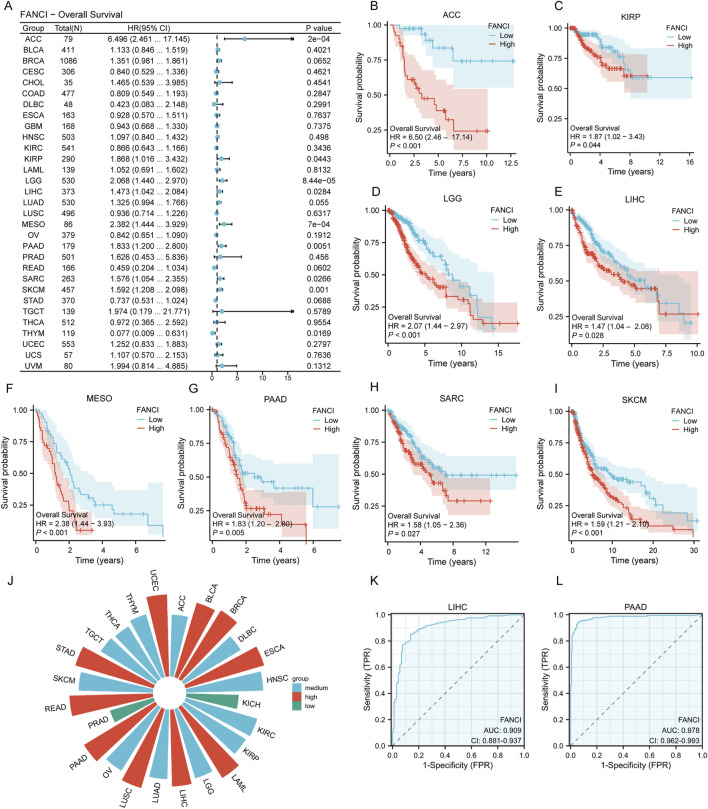
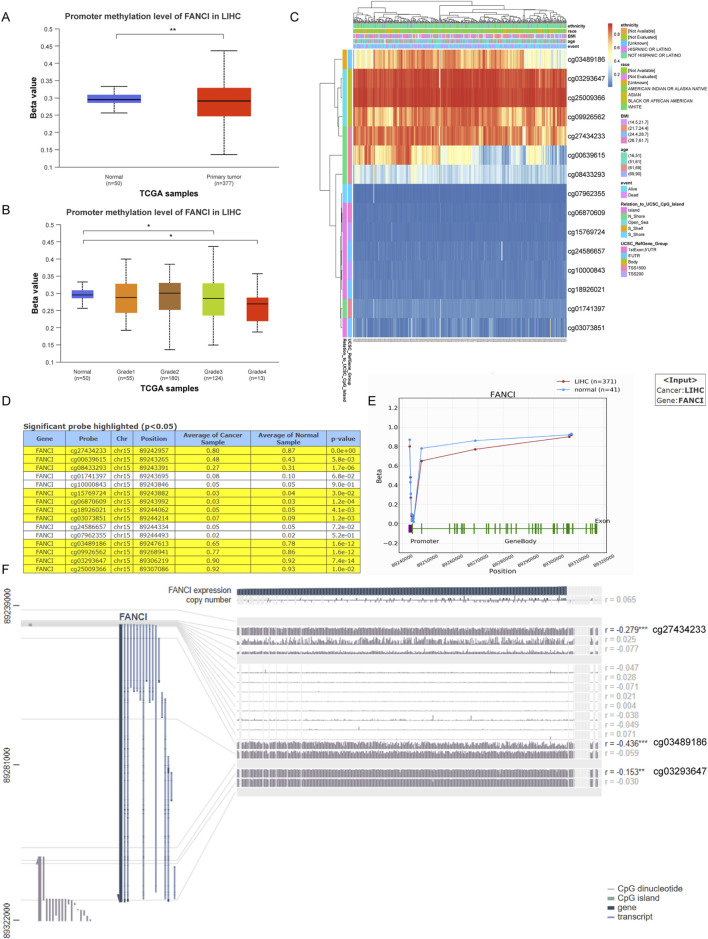
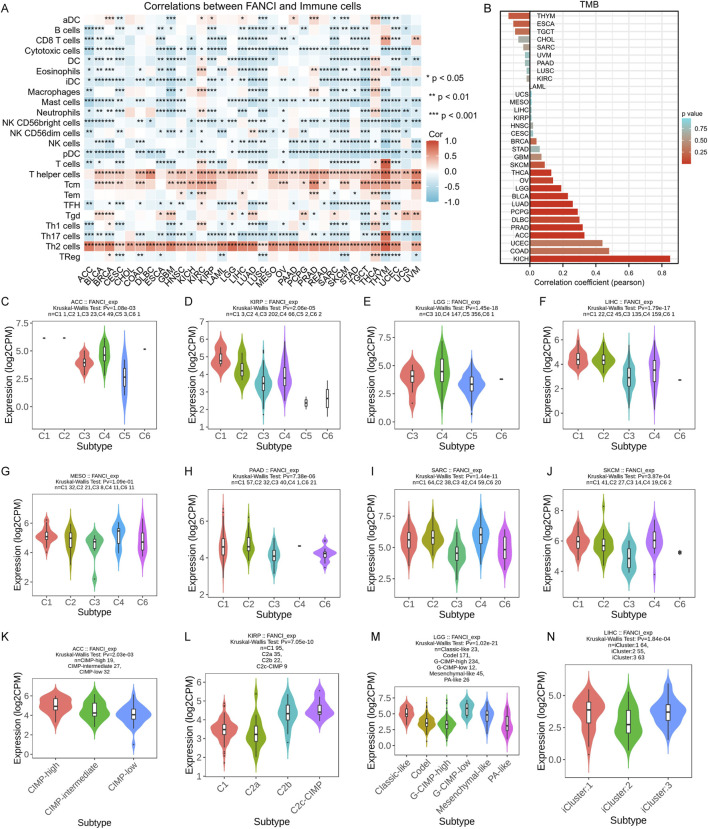
Results: Our findings reveal that FANCI is significantly upregulated in the majority of tumor types when compared to normal tissues, with increased protein levels observed in several cancers, including colorectal adenocarcinoma (COAD) and pancreatic adenocarcinoma (PAAD). Elevated FANCI expression is associated with unfavorable prognoses in cancers such as adrenocortical carcinoma (ACC) and liver hepatocellular carcinoma (LIHC). Methylation assessments demonstrated a robust inverse correlation between FANCI promoter methylation and its expression in LIHC. Moreover, FANCI expression was found to be connected to immune cell infiltration and tumor mutation burden in select cancers.
Discussion: In summary, FANCI presents as a promising biomarker for cancer prognosis and diagnosis, with potential implications for therapeutic interventions. Subsequent investigations should concentrate on elucidating the mechanistic functions of FANCI in cancer development and assessing its viability as a therapeutic target.
Keywords: DNA damage repair; FANCI; biomarker; clinical significance; gene expression; pan-cancer.
Copyright © 2025 Zhao, Li, Li, Cui and Lu.
Conflict of interest statement
The authors declare that the research was conducted in the absence of any commercial or financial relationships that could be construed as a potential conflict of interest.
Figures
Similar articles
-
Identification of SHCBP1 as a potential biomarker involving diagnosis, prognosis, and tumor immune microenvironment across multiple cancers.Comput Struct Biotechnol J. 2022 Jun 18;20:3106-3119. doi: 10.1016/j.csbj.2022.06.039. eCollection 2022. Comput Struct Biotechnol J. 2022. PMID: 35782736 Free PMC article.
-
UBR1 is a prognostic biomarker and therapeutic target associated with immune cell infiltration in gastric cancer.Aging (Albany NY). 2024 Aug 23;16(16):12029-12049. doi: 10.18632/aging.206079. Epub 2024 Aug 23. Aging (Albany NY). 2024. PMID: 39181686 Free PMC article.
-
Identifies microtubule-binding protein CSPP1 as a novel cancer biomarker associated with ferroptosis and tumor microenvironment.Comput Struct Biotechnol J. 2022 Jun 24;20:3322-3335. doi: 10.1016/j.csbj.2022.06.046. eCollection 2022. Comput Struct Biotechnol J. 2022. PMID: 35832625 Free PMC article.
-
Multiomic characterization, immunological and prognostic potential of SMAD3 in pan-cancer and validation in LIHC.Sci Rep. 2025 Jan 3;15(1):657. doi: 10.1038/s41598-024-84553-3. Sci Rep. 2025. PMID: 39753728 Free PMC article.
-
Pan-cancer analysis of the prognostic and immunological role of GJB2: a potential target for survival and immunotherapy.Front Oncol. 2023 Jun 23;13:1110207. doi: 10.3389/fonc.2023.1110207. eCollection 2023. Front Oncol. 2023. PMID: 37427102 Free PMC article. Review.
Cited by
-
Editorial: Screening and discovering novel biological biomarkers by omic-data to revolutionize tumor management.Front Genet. 2025 Jun 27;16:1611885. doi: 10.3389/fgene.2025.1611885. eCollection 2025. Front Genet. 2025. PMID: 40656593 Free PMC article. No abstract available.
References
-
- Birkbak N. J., Li Y., Pathania S., Greene-Colozzi A., Dreze M., Bowman-Colin C., et al. (2018). Overexpression of BLM promotes DNA damage and increased sensitivity to platinum salts in triple-negative breast and serous ovarian cancers. Ann. Oncol. 29 (4), 903–909. 10.1093/annonc/mdy049 - DOI - PMC - PubMed
LinkOut - more resources
Full Text Sources
Miscellaneous