. 2025 May 21;20(1):20251186.
doi: 10.1515/med-2025-1186. eCollection 2025.

Single-cell transcriptomic analysis identifies a stress response Schwann cell subtype

Affiliations

Single-cell transcriptomic analysis identifies a stress response Schwann cell subtype

Xianfeng Lan et al. Open Med (Wars). .

Abstract

Background: Peripheral nerve injury can lead to sensory, motor, and autonomic nerve dysfunction, significantly impacting patients' quality of life. Schwann cells (SCs), as key components of the peripheral nervous system, play a crucial role in nerve repair. However, many functionally specialized and flexible SC subtypes remain unidentified. Recent advancements in single-cell transcriptomics have enabled a deeper understanding of SC heterogeneity during peripheral nervous system development.

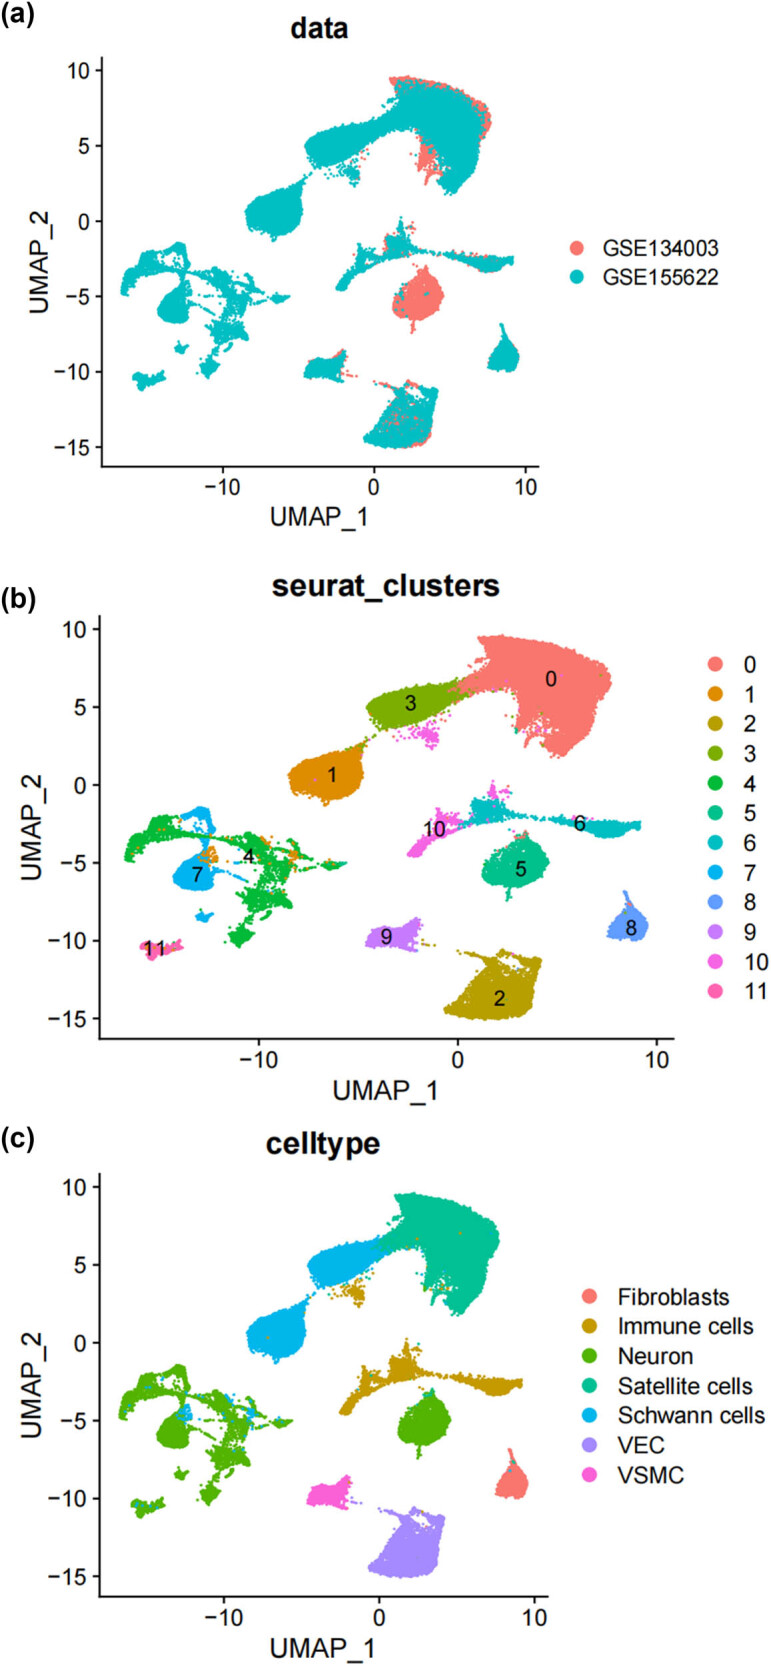
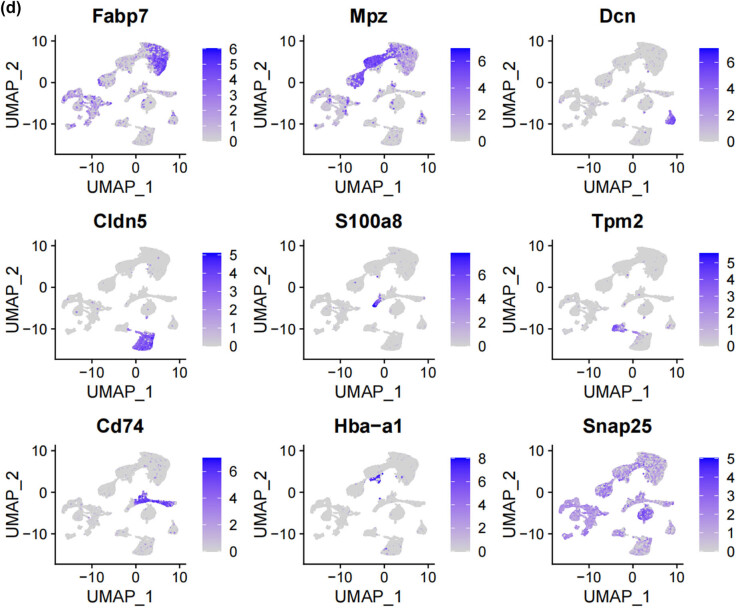
Methods: In this study, we utilized single-cell transcriptomics to investigate SC heterogeneity in the dorsal root ganglia of both normal and spinal nerve injury mouse models.

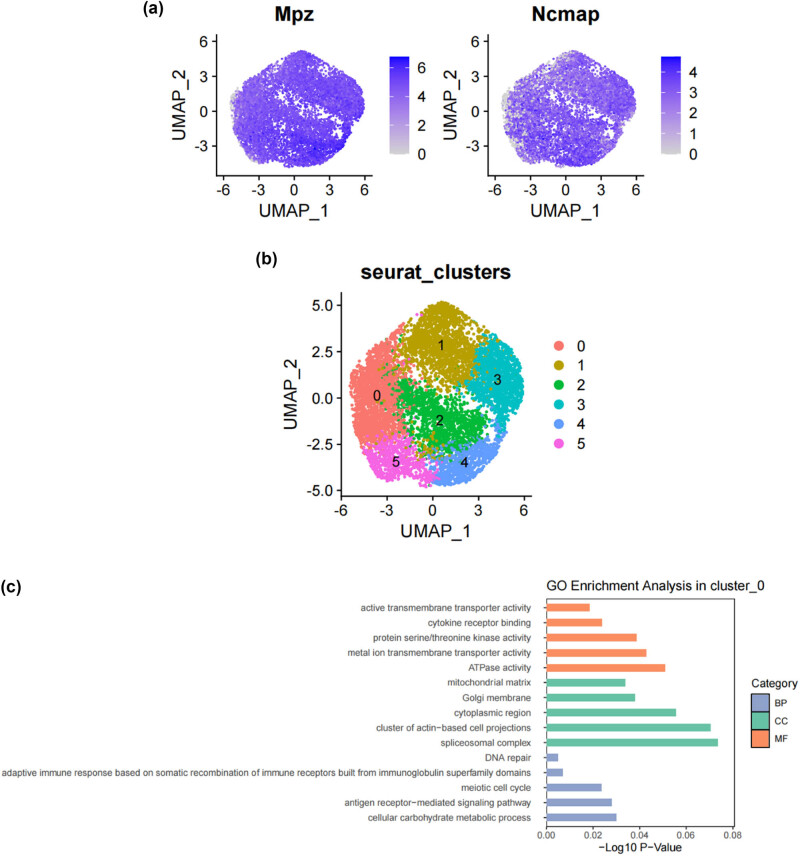
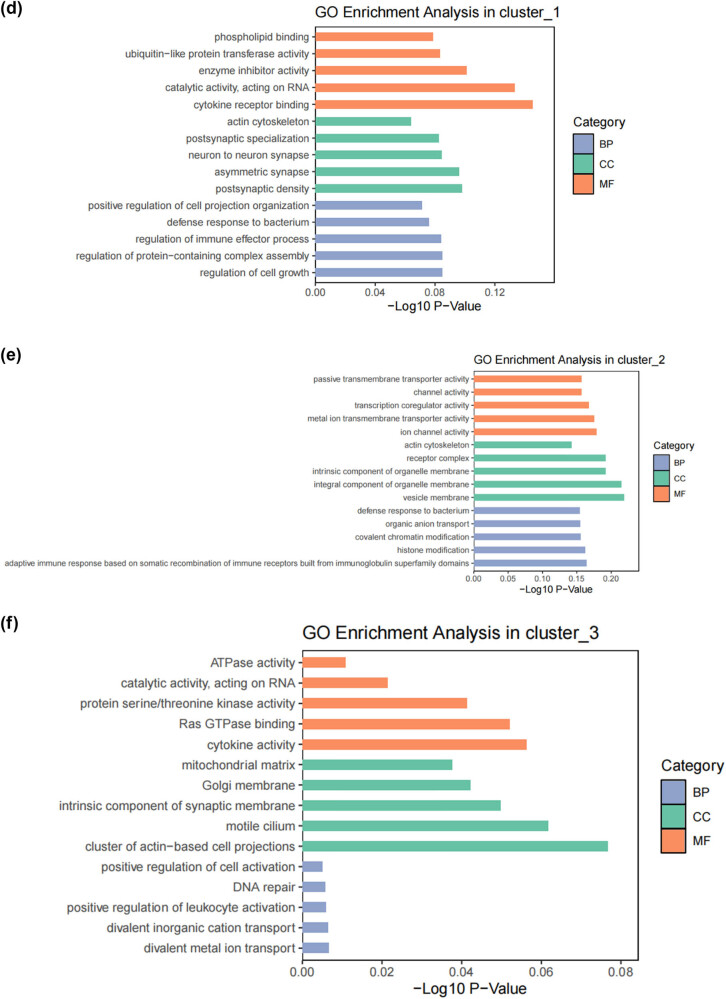
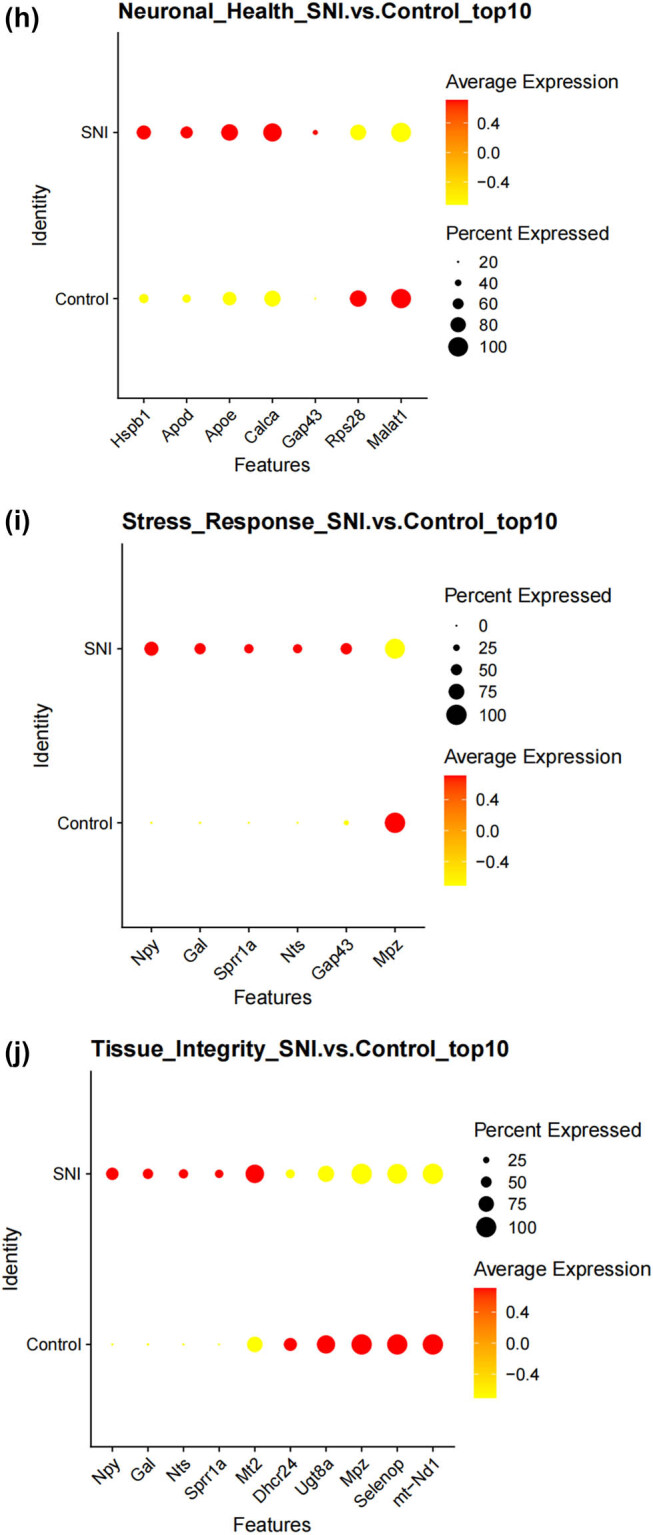
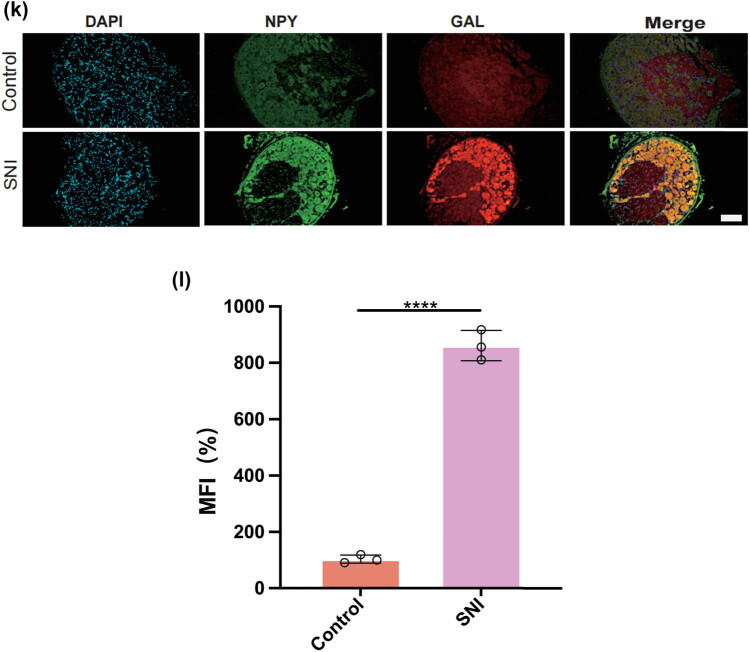
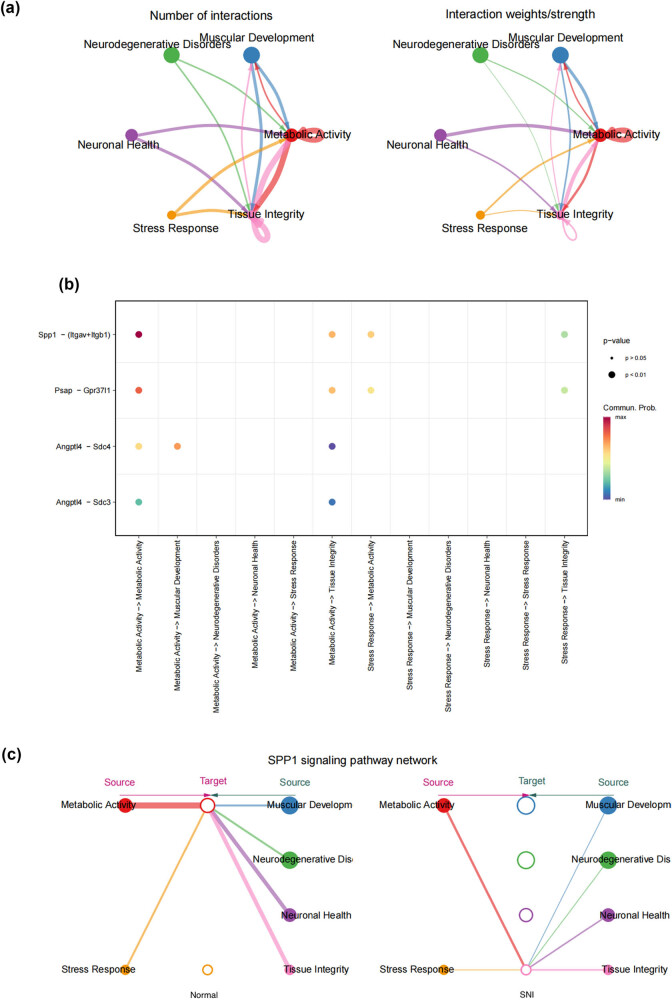
Results: We identified a novel SC subtype associated with pressure sensation, which we termed stress response related SCs (SRSCs). These cells are terminally differentiated and highly express the pressure-sensing gene Npy. Following peripheral nerve injury, SRSCs function as stimulus receptors, receiving external stimuli and transmitting signals to typical repair SCs via the SPP1 signaling network. This interaction promotes dedifferentiation and facilitates injury repair.

Conclusion: Our findings enhance the understanding of SC heterogeneity and reveal SRSCs as key players in nerve repair. These insights provide potential targets for developing novel therapeutic strategies for peripheral nerve diseases.

Keywords: Schwann cell; developmental trajectory; ingle-cell RNA sequencing; peripheral nerve injury; stress response.


Conflict of interest statement

Conflict of interest: The authors declare that the study was conducted in the absence of any commercial or financial relationships that could be construed as a potential conflict of interest.

Figures

Figure 1
Figure 1
Unbiased clustering identified known cell populations in mice DRG. (a) UMAP plot showing the distribution of each dataset after integrating datasets using the harmony algorithm; (b) and (c) UMAP plot revealing the integrated cell map, with 12 cell clusters (b) of 7 annotated cell types (c). Each dot presents one single cell colored by clusters; (d) UMAP plot showing the scaled expression of representative marker genes across cell types. 8525.
Figure 1
Figure 1
Unbiased clustering identified known cell populations in mice DRG. (a) UMAP plot showing the distribution of each dataset after integrating datasets using the harmony algorithm; (b) and (c) UMAP plot revealing the integrated cell map, with 12 cell clusters (b) of 7 annotated cell types (c). Each dot presents one single cell colored by clusters; (d) UMAP plot showing the scaled expression of representative marker genes across cell types. 8525.
Figure 2
Figure 2
Subtypes of SCs in the DRG. (a) UMAP plot showing representative genes in SCs; (b) UMAP plot of 8525 SCs clustered by annotated cell types; (c)–(h) GO enrichment analysis of six SC subtypes marker genes, shown in terms of biological process (BP), cellular component (CC), and molecular function (MF), BP refers to the biological processes the genes are involved in, CC denotes the cellular components where the genes are localized, and MF describes the molecular functions of the encoded proteins.; (i) UMAP plot showing the named SCs along with GO enrichment analysis; (j) UMAP plot showing the expression levels of selected genes in six cell subsets. UMAP plot (k) and Bar plot (l) showing the cell percentage of each SC subtype in Control and SNI mice.
Figure 2
Figure 2
Subtypes of SCs in the DRG. (a) UMAP plot showing representative genes in SCs; (b) UMAP plot of 8525 SCs clustered by annotated cell types; (c)–(h) GO enrichment analysis of six SC subtypes marker genes, shown in terms of biological process (BP), cellular component (CC), and molecular function (MF), BP refers to the biological processes the genes are involved in, CC denotes the cellular components where the genes are localized, and MF describes the molecular functions of the encoded proteins.; (i) UMAP plot showing the named SCs along with GO enrichment analysis; (j) UMAP plot showing the expression levels of selected genes in six cell subsets. UMAP plot (k) and Bar plot (l) showing the cell percentage of each SC subtype in Control and SNI mice.
Figure 3
Figure 3
The states of SCs in the DRG. (a) Trajectory plot illustrating the evolutionary trajectory of SCs; (b) trajectory plot illustrating the evolutionary trajectory of SCs colored by cell states; (c) branched heatmap showing genes with highly significant branch-specific expression patterns in the pseudotime trajectory; (d) ridge plot showing the Cell differentiation process of the five states of SCs; and (e) GSVA enrichment analysis of hallmark gene sets in SC subtypes.
Figure 3
Figure 3
The states of SCs in the DRG. (a) Trajectory plot illustrating the evolutionary trajectory of SCs; (b) trajectory plot illustrating the evolutionary trajectory of SCs colored by cell states; (c) branched heatmap showing genes with highly significant branch-specific expression patterns in the pseudotime trajectory; (d) ridge plot showing the Cell differentiation process of the five states of SCs; and (e) GSVA enrichment analysis of hallmark gene sets in SC subtypes.
Figure 4
Figure 4
Prediction of the differentiation of SC subtypes. (a) Monocle pseudotime analysis revealing the progression of six SC subtypes; (b) ridge plot of six SC subtypes; (c) heatmap showing the scaled expression of differently expressed genes in three clusters as in (b); (d) relative gene expression levels of Gal and Npy across different cell types.; (e)–(j) dot plot revealing the top 10 marker genes of indicated SC subtypes in control and SNI mice; (k) immunofluorescence staining of NPY and GAL. Scale bar = 20 μm. (l) Quantification of K.
Figure 4
Figure 4
Prediction of the differentiation of SC subtypes. (a) Monocle pseudotime analysis revealing the progression of six SC subtypes; (b) ridge plot of six SC subtypes; (c) heatmap showing the scaled expression of differently expressed genes in three clusters as in (b); (d) relative gene expression levels of Gal and Npy across different cell types.; (e)–(j) dot plot revealing the top 10 marker genes of indicated SC subtypes in control and SNI mice; (k) immunofluorescence staining of NPY and GAL. Scale bar = 20 μm. (l) Quantification of K.
Figure 5
Figure 5
SPP1 signaling induces distinct SC interactions in DRG. (a) The number of interactions in a cell–cell communication network (the left panel); the interaction weights/strength in a cell–cell communication network (the left panel); (b) dot plots showing significant ligand–receptor pairs between different SC subtypes; and (c) overview of SPP1 signaling networks in six SC subtypes.

Similar articles

References

    1. Wang ML, Rivlin M, Graham JG, Beredjiklian PK. Peripheral nerve injury, scarring, and recovery. Connect Tissue Res. 2019;60(1):3–9. - PubMed
    1. Li NY, Onor GI, Lemme NJ, Gil JA. Epidemiology of peripheral nerve injuries in sports, exercise, and recreation in the United States, 2009 - 2018. Phys Sportsmed. 2021;49(3):355–62. - PubMed
    1. Modrak M, Talukder MH, Gurgenashvili K, Noble M, Elfar JC. Peripheral nerve injury and myelination: Potential therapeutic strategies. J Neurosci Res. 2020;98(5):780–95. - PMC - PubMed
    1. Zhang M, Li L, An H, Zhang P, Liu P. Repair of peripheral nerve injury using hydrogels based on self-assembled peptides. Gels. 2021;7(4):152. - PMC - PubMed
    1. Bolívar S, Navarro X, Udina E. Schwann cell role in selectivity of nerve regeneration. Cells. 2020;9(9):2131. - PMC - PubMed

LinkOut - more resources