. 2025;9(5):666-671.
doi: 10.1038/s41550-025-02507-9. Epub 2025 Mar 26.

Discovery of H 3 + and infrared aurorae at Neptune with JWST

Affiliations

Discovery of H 3 + and infrared aurorae at Neptune with JWST

Henrik Melin et al. Nat Astron. 2025.

Abstract

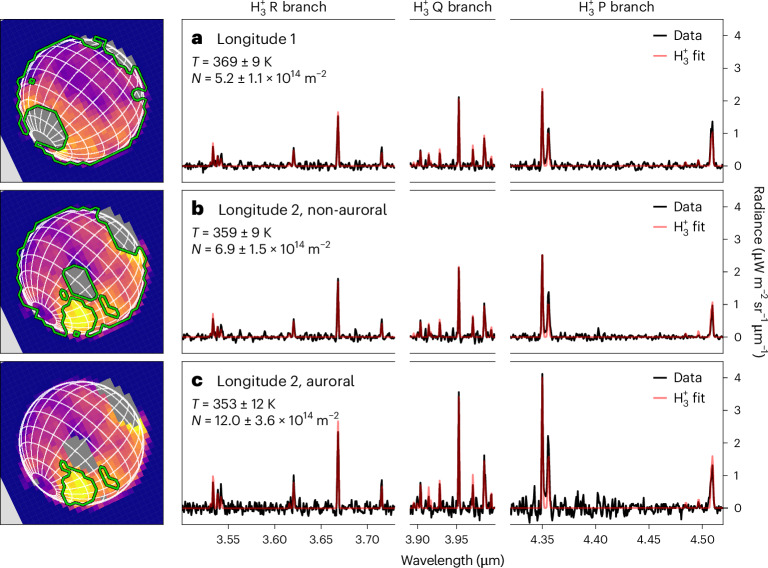
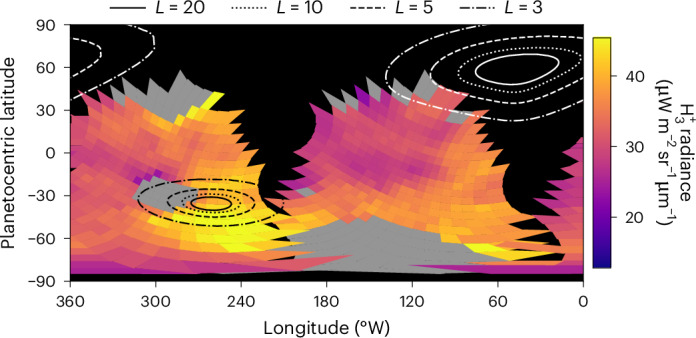
Emissions from the upper-atmospheric molecular ion H 3 + have been used to study the global-scale interactions of Jupiter, Saturn and Uranus with their surrounding space environments for over 30 years, revealing the processes shaping the aurorae. However, despite repeated attempts, and contrary to models that predict it should be present, this ion has proven elusive at Neptune. Here, using observations from the James Webb Space Telescope, we detect H 3 + at Neptune, as well as distinct infrared southern auroral emissions. The average upper-atmosphere temperature is a factor of two cooler than those derived 34 years ago by Voyager 2, showing that the energy balance of this region is regulated by physical processes acting on a timescale shorter than both Neptunian seasons (40 yr) and the solar cycle.

Keywords: Aurora; Giant planets.


Conflict of interest statement

Competing interestsThe authors declare no competing interests.

Figures

Fig. 1
Fig. 1. Detection of H3+ at Neptune.
a, The disk-median JWST NIRSpec spectrum from the two observed longitude sectors is shown in black, avoiding regions with bright 3 μm clouds, totalling 580 spaxels for both longitudes. The spectral pixel data density is shown as the green-to-blue background according to the colour bar. The red lines indicate the positions of bright H3+ lines, clearly present in the observed spectrum. b, The background-subtracted spectrum (black), revealing clear discrete emission lines of H3+. Only regions where the subtraction works well are shown, and regions outside this are shaded grey. The H3+ spectrum fits to a temperature of 358 ± 8 K and an ion column density of (7.2 ± 1.4) × 1014 m−2.
Fig. 2
Fig. 2. The JWST NIRSpec observations of Neptune.
a,b, The spatial distribution of reflective clouds, seen clearly at 3 μm across the disk for longitude 1 (a) and longitude 2 (b). The latitude and longitude grids have spacings of 15°. c,d, The spatial distribution of the sum of the brightest H3+ emission lines in Fig. 1. The grey areas show the regions of highly reflective clouds from which the H3+ intensity cannot be extracted. d shows an enhancement in the southern hemisphere, appearing in the post-noon sector on the right. This is generated by enhanced H3+ column density, probably indicative of localized auroral precipitation.
Fig. 3
Fig. 3. H3+ spectral fits at Neptune.
ac, Background-subtracted H3+ spectral fits for three different locations on the planet away from bright 3 μm clouds: all of longitude 1 (a), all of longitude 2, apart from the subregion of enhanced H3+ intensity (b), and the region of enhanced H3+ intensity in longitude 2 (c). The images on the left of the figure show H3+ intensity (from Fig. 2) and indicate the regions for which the medians were calculated for the extraction of the H3+ spectrum. Here, we consider emissions from the P, Q and R branches of H3+, referring to changes in the total angular momentum quantum number, ΔJ, of −1, 0 and +1, respectively.
Fig. 4
Fig. 4. Projected ionospheric emissions at Neptune.
The H3+ observations of Fig. 2c,d projected to planetocentric latitude and west longitude. The contours represent magnetic L shells, showing the magnetic mapping of the ionosphere (in RN). The positions of the auroral zones are a result of the offset and tilted magnetic field, which includes strong higher-order multipoles. The localized enhancement of H3+ located between 60° S and 30° S latitude and between 200° W and 280° W longitude coincides with the expected location in latitude of the southern aurora.
Fig. 5
Fig. 5. Solar-wind properties.
The propagated solar-wind properties at Neptune during the JWST observations. The vertical lines indicate the mid-point of the JWST NIRSpec observations detailed here.

References

    1. Drossart, P. et al. Detection of formula image on Jupiter. Nature340, 539–541 (1989).
    1. Geballe, T. R., Jagod, M.-F. & Oka, T. Detection of formula image infrared emission lines in Saturn. Astrophys. J. Lett.408, L109–L112 (1993).
    1. Trafton, L. M., Geballe, T. R., Miller, S., Tennyson, J. & Ballester, G. E. Detection of from formula image Uranus. Astrophys. J.405, 761–766 (1993).
    1. Miller, S. et al. formula image: the driver of giant planet atmospheres. Philos. Trans. R. Soc. A364, 3121–3137 (2006). - PubMed
    1. Larsson, M. formula image: the initiator of interstellar chemistry. Int. J. Astrobiol.7, 237–241 (2008).

LinkOut - more resources