. 2025 May 23;7(3):fcaf175.
doi: 10.1093/braincomms/fcaf175. eCollection 2025.

Evidence that minocycline treatment confounds the interpretation of neurofilament as a biomarker

Affiliations

Evidence that minocycline treatment confounds the interpretation of neurofilament as a biomarker

Juliana E Gentile et al. Brain Commun. .

Abstract

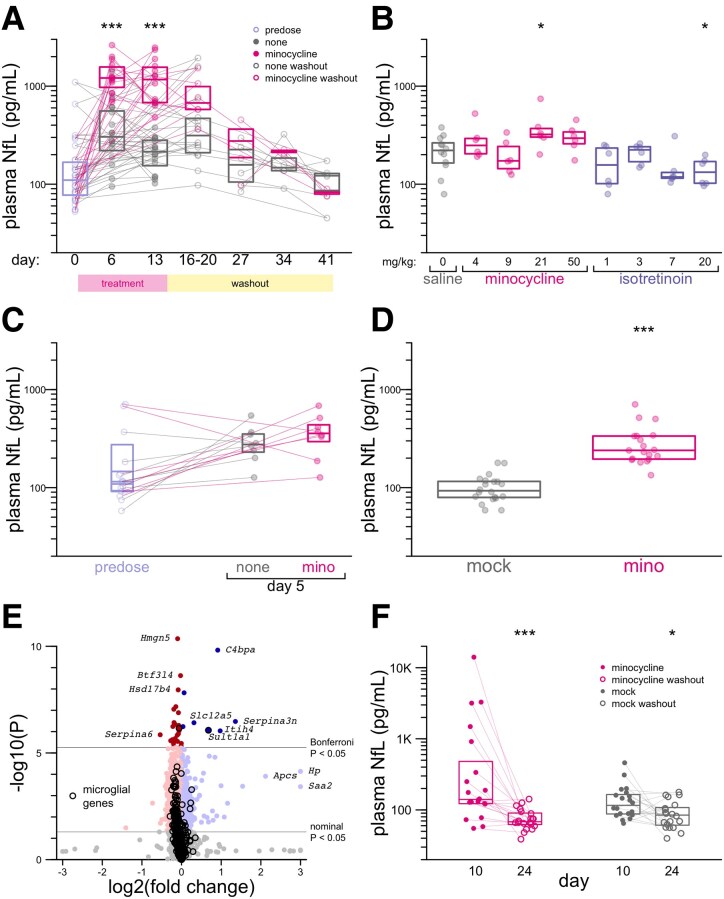
Neurofilament light (NfL) concentration in CSF and blood serves as an important biomarker in neurology drug development. Changes in NfL are generally assumed to reflect changes in neuronal damage, while little is known about the clearance of NfL from biofluids. In a study of asymptomatic individuals at risk for prion disease, both blood and CSF NfL spiked in one participant following a 6-week course of minocycline, absent any other biomarker changes and without subsequent onset of symptoms. We subsequently observed high NfL after minocycline treatment in discarded clinical plasma samples from inpatients, in mouse plasma and in conditioned media from neuron-microglia co-cultures. The specificity and kinetics of NfL response lead us to hypothesize that minocycline does not cause or exacerbate neuronal damage, but instead affects NfL by inhibiting its clearance, posing a potential confounder for the interpretation of this important biomarker.

Keywords: CSF; biomarker; minocycline; neurofilament.


Conflict of interest statement

B.E., R.K., A.E. and C.B. are employees of IQ Proteomics. K.T.H. is an employee of Charles River Laboratories. S.E.A. acknowledges speaking fees from Abbvie, Biogen, EIP Pharma, Roche and Sironax; consulting fees from Athira, Biogen, Cassava, Cognito, Cortexyme, Sironax and vTv; and research support from Abbvie, Amylyx, EIP Pharma and Merck. E.V.M. acknowledges speaking fees from Eli Lilly; consulting fees from Deerfield and Alnylam; and research support from Ionis, Gate, Sangamo and Eli Lilly. H.Z. is co-founder of Brain Biomarker Solutions in Gothenburg AB and a GU Ventures-based platform company at the University of Gothenburg. S.M.V. acknowledges speaking fees from Ultragenyx, Illumina, Biogen and Eli Lilly; consulting fees from Invitae and Alnylam; and research support from Ionis, Gate, Sangamo and Eli Lilly.

Figures

Graphical Abstract
Graphical Abstract
Figure 1
Figure 1
Proteomic analysis of serial CSF samples from the minocycline-treated index case. CSF samples collected by lumbar puncture (LP) were analysed by TMTs in technical duplicate in a single plex. Of the 6705 peptides quantified (Supplementary Table 1), 6588 with technical replicate coefficient of variation (CV) < 25% were grouped by gene symbol (note italicized gene symbols: NEFL = NfL, neurofilament light; NEFM = NfM, neurofilament medium) to yield relative protein abundance (Supplementary Table 2). Of the 1215 gene symbols encoding detected peptides, 1190 had a coefficient of variation (%CV) among the three baseline samples (baseline %CV) of <100% and were analysed here. (A) Coefficient of variation among the three baseline samples (baseline %CV) versus fold change at 4 days post-minocycline relative to the baseline mean. Each point represents one gene symbol. (B) Ratio of each sample’s abundance to the mean of the three baseline visits. Each point represents one gene symbol at one CSF sampling time point.
Figure 2
Figure 2
Plasma NfL levels in discarded plasma cohorts. (A) Plasma NfL in control patients with a recent well visit (grey) or with a recent dermatology encounter, diagnosis of acne, rosacea, dermatitis or eczema and a recent prescription start for topical clindamycin, oral doxycycline, oral isotretinoin or oral minocycline. For detailed inclusion criteria, see Materials and methods. Points represent individual patients; where multiple blood samples were available for one patient, the mean plasma NfL value is plotted. Curves represent log-linear regression best fits for each group with n > 1. n = 113 individuals in total; for individual values and model fits, see Supplementary Tables 4 and 5. (B) Plasma NfL in inpatients prescribed minocycline, n = 215 samples from n = 20 individuals. Points represent the mean on and mean off values for each patient, with thin lines connecting on/off means for the same patient. P = 0.059, two-sided partially paired Wilcoxon test. Individual NfL trajectories and times on/off drug for each inpatient are shown in Supplementary Fig. 1. Inpatient details are provided in Supplementary Tables 6–8. Route of administration was oral (n = 12), intravenous (n = 6) or both at various times (n = 2). Dose was 200 mg/day in all cases where it could be determined (see Materials and methods).
Figure 3
Figure 3
Neurofilament in mice treated with minocycline. (A) Plasma NfL values in mouse Study 1, with 50 mg/kg minocycline. See text for details. Points represent individual animal–time point combinations. (B) Plasma NfL values in mouse Study 2, doses as indicated. Points represent individual animals. (C) Plasma NfL values in mouse Study 3, with 50 mg/kg minocycline. Points represent individual animals. (D) Plasma NfL values in mouse Study 4, after 5 days of 50 mg/kg minocycline. Points represent individual animal–time point combinations. (E) TMTs on whole brain hemispheres of n = 9 minocycline versus n = 9 mock-treated mice in mouse Study 4, sacrificed at Day 5. Each point represents one gene symbol (n = 9051 proteins quantified). P values are obtained by Empirical Brown’s method with Bonferroni correction. (F) Plasma NfL values in mouse Study 4, after 10 days of 50 mg/kg minocycline and after 14 subsequent days of wash-out (no dosing). Points represent individual animal–time point combinations. In A–D and F, two-sided Wilcoxon tests are used; *P < 0.05, **P < 0.01, ***P < 0.001.
Figure 4
Figure 4
Neurofilament in conditioned media of neuron–microglia co-cultures. (A) NfL concentration in conditioned media of neuron–microglia co-cultures treated with 25 µM minocycline or no treatment. Points represent the n = 6 biological replicates (culture wells) per condition, followed serially over 10 days; every 2 days, media were removed and analysed for NfL, and new media were added. Boxes represent medians and interquartile ranges. **P < 0.01 by two-sided Wilcoxon test. Raw and summarized values are provided in Supplementary Tables 29 and 30. (B and C) Representative images of control (B) and minocycline-treated (C) co-cultures. Blue: DAPI; green: TuJ1; Magenta: Iba1. Separate TuJ1 and Iba1 channels are provided in Supplementary Fig. 4.

Update of

References

    1. Yuan A, Rao MV, Veeranna, Nixon RA. Neurofilaments and neurofilament proteins in health and disease. Cold Spring Harb Perspect Biol. 2017;9(4):a018309. - PMC - PubMed
    1. Bridel C, van Wieringen WN, Zetterberg H, et al. Diagnostic value of cerebrospinal fluid neurofilament light protein in neurology: A systematic review and meta-analysis. JAMA Neurol. 2019;76(9):1035–1048. - PMC - PubMed
    1. Ashton NJ, Janelidze S, Al Khleifat A, et al. A multicentre validation study of the diagnostic value of plasma neurofilament light. Nat Commun. 2021;12(1):3400. - PMC - PubMed
    1. Kuhle J, Kropshofer H, Haering DA, et al. Blood neurofilament light chain as a biomarker of MS disease activity and treatment response. Neurology. 2019;92(10):e1007–e1015. - PMC - PubMed
    1. Olsson B, Alberg L, Cullen NC, et al. NFL is a marker of treatment response in children with SMA treated with nusinersen. J Neurol. 2019;266(9):2129–2136. - PMC - PubMed

LinkOut - more resources