. 2025;3(5):590-604.
doi: 10.1038/s44221-025-00430-x. Epub 2025 May 7.

Long-term multi-meta-omics resolves the ecophysiological controls of seasonal N2O emissions during wastewater treatment

Affiliations

Long-term multi-meta-omics resolves the ecophysiological controls of seasonal N2O emissions during wastewater treatment

Nina Roothans et al. Nat Water. 2025.

Abstract

Nitrous oxide (N2O) is the third most important greenhouse gas and originates primarily from natural and engineered microbiomes. Effective emission mitigations are currently hindered by the largely unresolved ecophysiological controls of coexisting N2O-converting metabolisms in complex communities. To address this, we used biological wastewater treatment as a model ecosystem and combined long-term metagenome-resolved metaproteomics with ex situ kinetic and full-scale operational characterization over nearly 2 years. By leveraging the evidence independently obtained at multiple ecophysiological levels, from individual genetic potential to actual metabolism and emergent community phenotype, the cascade of environmental and operational triggers driving seasonal N2O emissions has ultimately been resolved. We identified nitrifier denitrification as the dominant N2O-producing pathway and dissolved O2 as the prime operational parameter, paving the way to the design and fostering of robust emission control strategies. This work exemplifies the untapped potential of multi-meta-omics in the mechanistic understanding and ecological engineering of microbiomes towards reducing anthropogenic impacts and advancing sustainable biotechnological developments.

Keywords: Climate-change ecology; Ecophysiology; Environmental biotechnology; Microbial ecology.


Conflict of interest statement

Competing interestsThe authors declare no competing interests.

Figures

Fig. 1
Fig. 1. Schematic representation of the nitrogen cycle, experimental approach and obtained datasets.
a, Nitrogen conversions in the biological nitrogen removal process and the corresponding enzyme complexes. AOB aerobically oxidize NH4+ to NH2OH with ammonia monooxygenase (AMO), NH2OH to NO with hydroxylamine oxidoreductase (HAO) and NO to NO2 with a yet unknown enzyme. AOB can biologically produce N2O through the oxidation of NH2OH with cytochrome P460 (Cyt P460) or through the reduction of NO, produced by NH2OH oxidation or nitrifier denitrification (NO2 reduction with nitrite reductase (NIR)), with nitric oxide reductase (NOR; dotted arrows). NOB aerobically oxidize NO2 to nitrate (NO3) with nitrite oxidoreductase (NXR) and encode NIR, but its activity and function remain to be resolved. Normally under anoxic conditions, DEN reduce NO3 to NO2 with membrane-bound or periplasmic nitrate reductase (NAR and NAP), NO2 to NO with NIR, NO to N2O with NOR and N2O to N2 with nitrous oxide reductase (NOS). Some DEN perform only some of the steps of the denitrification pathway, while others perform the entire pathway. b, Overview of the methodological approach adopted in this study for the 18-month characterization of a full-scale WWTP to resolve the microbial mechanisms underlying seasonal N2O emissions. Sludge samples were used for metagenomics (6 samples), metaproteomics (12 samples) and ex situ activity tests at 20 °C (29 samples). Predicted proteins in the metagenomics data were used as protein database (DB) in the metaproteomics analysis. The activity tests were carried out by following the decrease in nitrogen substrates concentrations (Csubstrate) over time. Created in BioRender. Roothans, N. (2025) https://BioRender.com/q43b584.
Fig. 2
Fig. 2. Performance of the WWTP monitored for nearly 2 years.
Weekly average parameters measured at the Amsterdam-West WWTP from October 2020 to July 2022 (from back to front, light green to dark blue): concentrations of NH4+ and dissolved O2 in the nitrification compartment (left axis), pooled effluent NO2 concentration and N2O emission rates measured in the off-gas from all reactor compartments (right axis). The water temperature inside the reactor is also shown (circles, right axis). All metabolites were measured in a single biological nutrient removal lane of the WWTP, except the effluent NO2 (seven lanes pooled together). Occasional sharp NH4+ peaks were caused by outliers on rainy days (Supplementary Fig. 2). The scheme above the plot shows the sampling time points for metagenomic (DNA), metaproteomic (protein) and ex situ activity (bioreactor) tests. Timeline icons created in BioRender. Roothans, N. (2025) https://BioRender.com/q43b584.
Fig. 3
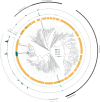
Fig. 3. Phylogenetic tree of the 347 bacterial HQ MAGs extracted from activated sludge.
From the inner to the outer circle: circular phylogenetic tree with the identification of the key activated sludge genera Nitrosomonas, Nitrospira, Ca. Accumulibacter and Ca. Microthrix; identification of AOB (containing amoABC genes, dark blue), NOB (containing nxrAB genes, light blue), denitrifying organisms (DEN, non-AOB and non-NOB MAGs harbouring at least one denitrification gene, yellow) and other organisms (white); some of the AOB and NOB MAGs also contained one or more denitrification genes (Supplementary Data 4); average relative DNA abundance of each MAG in the community; average relative protein abundance of each MAG in the community; identification of the six most abundant phyla. The two archaeal MAGs are not represented.
Fig. 4
Fig. 4. MAG-based functional guild distribution in the metagenomes and metaproteomes of the activated sludge.
a, Average relative abundance of denitrifying bacteria (DEN, non-AOB and non-NOB MAGs containing at least one denitrification gene, yellow), NOB (containing nxrAB genes, light blue), AOB (containing amoABC genes, dark blue), other MAGs (dark grey) and unbinned sequences (light grey) in the total metagenome (DNA) and metaproteome (protein) of the activated sludge. Some of the AOB and NOB MAGs also contained one or more denitrification genes (Supplementary Data 4). The bars represent the mean and the error bars represent the standard deviation for 6 (DNA) and 12 (protein) activated sludge samples taken at different time points throughout 18 months. b, MAG-based composition of the DEN, NOB and AOB guilds. The most abundant genera in the DEN (Ca. Accumulibacter and Candidatus Competibacter), NOB (unidentified Promineofilaceae genus, Ca. Nitrotoga and Nitrospira) and AOB (Nitrosomonas) guilds are highlighted. c, Temporal fluctuations in the relative protein abundance of the DEN, NOB and AOB guilds. The error bars represent standard deviations between technical duplicates and are all smaller than the symbols.
Fig. 5
Fig. 5. Genomic, proteomic and maximum activity fluctuations of AOB and NOB in activated sludge during periods of high and low nitrite accumulation.
a,b, Ratios between the total relative abundance of DNA (a) and protein (b) of AOB and NOB (circles). The symbols represent the mean and the error bars represent the standard deviations of technical duplicates independently analysed by liquid chromatography–tandem mass spectrometry (LC–MS/MS); some error bars are smaller than the symbols. c, Ratios between the relative abundance of NO2-producing and -consuming enzymes of AOB and NOB, respectively: AmoBAOB/NxrANOB (diamonds) and HaoAOB/NxrANOB (circles). The enzyme abundances include proteins belonging to the MAGs and unbinned fraction. The symbols in b,c represent the mean and the error bars represent the standard deviations of technical duplicates independently analysed by LC–MS/MS; some error bars are smaller than the symbols. The corresponding enzyme conversions are represented on the right. d, Ratio between the maximum ex situ NH4+ and NO2 oxidation rates (rmax) measured at 20 °C (circles). The data in ad are overlaid on the weekly average NO2 concentration in the effluent (seven parallel lanes pooled together, grey shading, right axis). The correlation coefficients between the WWTP parameters and microbial ratios represented here and their statistical significance are reported in Supplementary Table 7.
Fig. 6
Fig. 6. NirK overexpression relative to other nitrogen enzymes during periods of high NO2 concentrations and N2O emissions.
a, Ratios between the total relative abundance of NO2-consuming NirK and the key AOB enzymes AmoB (triangles) and Hao (circles). b, Ratios between the total relative abundance of NO2-consuming NirK and the NO2-competing enzymes NirS (DEN, triangles) and NxrA (NOB, circles). c, NirK in N2O balance. Ratio between the total relative abundance of NirK (producing the N2O precursor NO) and the only known enzymatic N2O-sink N2O reductase (NosZ). The enzyme abundances include proteins belonging to the MAGs and unbinned fraction. The symbols represent the mean and the error bars represent the standard deviations of technical duplicates independently analysed by LC–MS/MS; some error bars are smaller than the symbols. All enzymatic conversions are schematically represented on the right. NirK is expressed by both AOB and NOB, but the activity and function of the enzyme in NOB are yet unknown. The data in ac are overlaid on weekly average NO2 concentration in the effluent of the WWTP (seven parallel lanes pooled together, grey shading, right axis) and N2O emission rates measured in the off-gas from all the reactor compartments in one lane at the WWTP (grey line, right axis). The correlation coefficients between the WWTP parameters and the microbial ratios represented here and their statistical significance are reported in Supplementary Table 7.
Fig. 7
Fig. 7. Schematic representation of the proposed ecophysiological cascade underlying seasonal N2O emissions in WWTPs.
A decrease in temperature causes lower growth rates (μ) of AOB and NOB, promoting ammonium accumulation and a selective washout of the slower growing NOB. The resulting increased ammonium concentration stimulates the growth of AOB and induces the process control to increase the operational concentration of DO. The increased O2 concentration increases the growth rates of both AOB and NOB, but may selectively benefit AOB due to its lower apparent affinity for O2. The resulting increased AOB/NOB ratio leads to the accumulation of nitrite and consequent stimulation of nitrifier denitrification by AOB, as observed in the overexpression of the Cu-type nitrite reductase (NirK). The increases in concentrations of ammonium, nitrite and N2O are a result of changes in the microbial community metabolism, while the increase in O2 concentration is the only manually controlled parameter in the cascade.

Similar articles

References

    1. IPCC Climate Change 2014: Synthesis Report (eds Core Writing Team, Pachauri, R. K. & Meyer L. A.) (IPCC, 2014).
    1. Tian, H. et al. A comprehensive quantification of global nitrous oxide sources and sinks. Nature586, 248–256 (2020). - PubMed
    1. Vasilaki, V., Massara, T. M., Stanchev, P., Fatone, F. & Katsou, E. A decade of nitrous oxide (N2O) monitoring in full-scale wastewater treatment processes: a critical review. Water Res.161, 392–412 (2019). - PubMed
    1. Marchant, H. K. et al. Denitrifying community in coastal sediments performs aerobic and anaerobic respiration simultaneously. ISME J.11, 1799–1812 (2017). - PMC - PubMed
    1. Freing, A., Wallace, D. W. R. & Bange, H. W. Global oceanic production of nitrous oxide. Philos. Trans. R. Soc. B367, 1245–1255 (2012). - PMC - PubMed

LinkOut - more resources