

Development and validation of a nomogram for predicting low bone mineral density in male patients with ankylosing spondylitis
- PMID: 40417697
- PMCID: PMC12098366
- DOI: 10.3389/fmed.2025.1549653
Development and validation of a nomogram for predicting low bone mineral density in male patients with ankylosing spondylitis
Abstract
Objective: This retrospective cohort study aimed to develop and validate clinical nomogram models for predicting site-specific low bone mineral density (BMD) risk in male patients with ankylosing spondylitis (AS).
Methods: This study enrolled male AS patients treated at the Rheumatology Department of Jiangsu Provincial Hospital of Traditional Chinese Medicine between January 2017 and September 2024. A total of 322 eligible patients were randomly allocated to training and validation cohorts at a 7:3 ratio. Potential predictors of low BMD at the lumbar spine (LS) and left hip (LH) were initially screened through univariate logistic regression (p < 0.05), followed by stepwise bidirectional multivariate logistic regression (entry criteria p < 0.05) to identify independent predictors for each anatomical site. Based on the regression coefficients, we developed visualized nomogram prediction models for LS and LH low BMD, accompanied by an interactive online prediction tool. The models were comprehensively evaluated for discrimination, calibration, and clinical utility. After identifying the primary predictive factors, exploratory subgroup analyses were conducted to assess effect heterogeneity of key variables (BMI and serum uric acid).
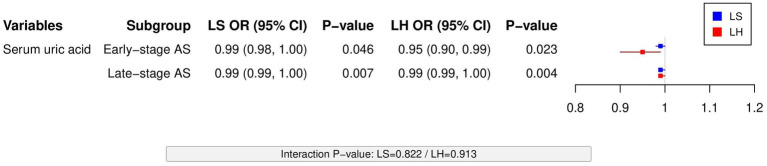
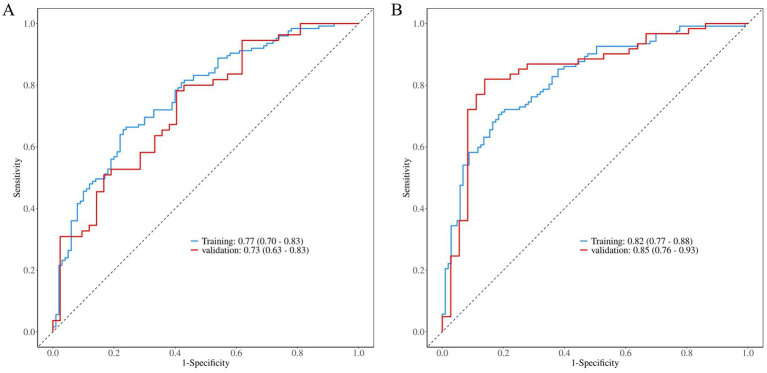
Results: This study included 322 male AS patients randomly allocated to training (n = 225) and validation (n = 97) cohorts with balanced baseline characteristics (all p > 0.05). Multivariate logistic regression identified age at onset (LS OR = 0.96, 95%CI:0.93-0.99; LH OR = 0.97, 95%CI: 0.95-0.99), BMI (LS OR = 0.90, 95%CI: 0.81-0.99; LH OR = 0.81, 95%CI: 0.72-0.91), serum uric acid (LS/LH OR = 0.99, 95%CI: 0.99-0.99), and hip involvement (LS OR = 3.22, 95%CI: 1.71-6.05; LH OR = 8.03, 95%CI: 4.01-16.09) as common independent predictors for low BMD at both sites, while serum calcium (OR = 12.19, 95%CI: 1.44-103.25) was specific to LS. The developed nomograms, including web-based versions, demonstrated good discrimination (LS AUC: 0.77 training/0.73 validation; LH AUC: 0.82/0.85) and calibration. Decision curve analysis revealed significant net clinical benefit across probability thresholds (LS: 0.17-0.86 training/0.20-0.82 validation; LH: 0.15-0.92/0.27-0.91). The protective effect of BMI exhibited site-specific patterns: LS (low-TC: OR = 0.86; high-TC: OR = 0.77), LH (low-TC: OR = 0.77; mid-TC: OR = 0.74), with the most pronounced effect observed in the LS low-TG subgroup (OR = 0.79). SUA demonstrated consistent protective effects (LS/LH: OR = 0.95-0.99, all p < 0.05), potentially independent of disease stage. Interaction analyses revealed that neither lipid levels nor disease stage significantly modified the effects of BMI and SUA (all interaction p > 0.4).
Conclusion: This study developed clinical prediction models with excellent discriminative ability and substantial clinical utility for male patients with AS. These models offer rheumatologists an efficient tool to rapidly assess individual risks of low BMD, facilitating early diagnostic decision-making and enabling personalized interventions tailored to anatomical site-specific osteoporosis risks.
Keywords: ankylosing spondylitis; dynamic nomogram; early prevention; low bone mineral density; prediction model.
Copyright © 2025 Yang, Cheng, Li, Tang, Chen, Ma, Gao and Ji.
Conflict of interest statement
The authors declare that the research was conducted in the absence of any commercial or financial relationships that could be construed as a potential conflict of interest.
Figures


References
-
- Van Der Weijden MAC, Van Denderen JC, Lems WF, Heymans MW, Dijkmans BAC, Van Der Horst-Bruinsma IE. Low bone mineral density is related to male gender and decreased functional capacity in early spondylarthropathies. Clin Rheumatol. (2011) 30:497–503. doi: 10.1007/s10067-010-1538-8, PMID: - DOI - PMC - PubMed
-
- Danda D. Osteoporosis in ankylosing spondylitis. Int J Rheum Dis. (2008) 11:374–80. doi: 10.1111/j.1756-185X.2008.00394.x, PMID: - DOI
LinkOut - more resources
Full Text Sources
Research Materials
Miscellaneous