Blood-Brain Barrier Integrity and Transport of Major Hormones are Unchanged in Mice With Euglycemic Hyperinsulinemia
- PMID: 40418654
- PMCID: PMC12149529
- DOI: 10.1210/endocr/bqaf095
Blood-Brain Barrier Integrity and Transport of Major Hormones are Unchanged in Mice With Euglycemic Hyperinsulinemia
Abstract
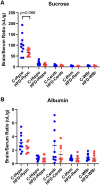
High-fat diet (HFD) consumption increases the risk of metabolic syndrome as manifested by insulin resistance, fatty liver, hypertriglyceridemia, and diabetes mellitus type 2. Blood-brain barrier (BBB) disruptions and impaired BBB transport of metabolic hormones, including leptin, insulin, and ghrelin, occur in diabetes mellitus type 2 and contribute to metabolic dysregulation and cognitive impairment. However, it is unclear whether the BBB changes are caused by the HFD, obesity, insulin resistance, elevated glucose or triglyceride levels, or other aspects of the metabolic syndrome. This study examined the effects of chronic HFD and an early stage of metabolic syndrome on BBB disruption and transport of insulin, leptin, and ghrelin. Mice on the HFD demonstrated obesity, increases in insulin, leptin, plasminogen activator inhibitor-1, and resistin, fatty liver and hyperglycerolemia, without elevations in glucose, triglycerides, ghrelin, glucagon, gastric inhibitory polypeptide, or glucagon-like peptide. The vascular markers of sucrose and albumin did not show BBB disruption. HFD did not alter the rate of insulin, leptin, or ghrelin transport across the BBB. However, leptin binding to the luminal surface of the BBB was greater in the hypothalamus and reduced for the rest of the brain with HFD treatment. The liver uptake of insulin, leptin, and ghrelin was reduced in the HFD group. Overall, our findings indicate that chronic HFD consumption with concomitant obesity and insulin resistance in the absence of hyperglycemia does not result in BBB disruption or altered BBB permeability to key metabolic hormones but may selectively affect vascular binding of important metabolic hormones in the brain and liver.
Keywords: blood-brain barrier; diet-induced obesity; hyperglycemia; insulin; leptin.
Published by Oxford University Press on behalf of the Endocrine Society 2025.
Figures


Similar articles
-
Telmisartan prevents diet-induced obesity and preserves leptin transport across the blood-brain barrier in high-fat diet-fed mice.Pflugers Arch. 2018 Nov;470(11):1673-1689. doi: 10.1007/s00424-018-2178-0. Epub 2018 Jul 5. Pflugers Arch. 2018. PMID: 29978352
-
Endothelial Adora2a Activation Promotes Blood-Brain Barrier Breakdown and Cognitive Impairment in Mice with Diet-Induced Insulin Resistance.J Neurosci. 2019 May 22;39(21):4179-4192. doi: 10.1523/JNEUROSCI.2506-18.2019. Epub 2019 Mar 18. J Neurosci. 2019. PMID: 30886019 Free PMC article.
-
Time-resolved hypothalamic open flow micro-perfusion reveals normal leptin transport across the blood-brain barrier in leptin resistant mice.Mol Metab. 2018 Jul;13:77-82. doi: 10.1016/j.molmet.2018.04.008. Epub 2018 Apr 27. Mol Metab. 2018. PMID: 29748097 Free PMC article.
-
The blood-brain barrier as a regulatory interface in the gut-brain axes.Physiol Behav. 2006 Nov 30;89(4):472-6. doi: 10.1016/j.physbeh.2006.07.004. Epub 2006 Aug 10. Physiol Behav. 2006. PMID: 16904139 Review.
-
The blood-brain barrier: connecting the gut and the brain.Regul Pept. 2008 Aug 7;149(1-3):11-4. doi: 10.1016/j.regpep.2007.08.027. Epub 2008 Apr 7. Regul Pept. 2008. PMID: 18486244 Free PMC article. Review.
References
MeSH terms
Substances
Grants and funding
LinkOut - more resources
Full Text Sources

