. 2025 Aug:98:102170.
doi: 10.1016/j.molmet.2025.102170. Epub 2025 May 24.

JNK1 in SF1 neurons regulates the central action of thyroid hormones on hepatic lipid metabolism

Affiliations

JNK1 in SF1 neurons regulates the central action of thyroid hormones on hepatic lipid metabolism

Iara Fernández-González et al. Mol Metab. 2025 Aug.

Abstract

Objective: Hypothalamic energy sensors, such as AMP-activated protein kinase (AMPK), and stress sensors, such as c-Jun N-terminal kinase 1 (JNK1, also known as MAPK8) modulate whole body energy balance. While the role of AMPK in steroidogenic factor 1 (SF1) neurons of the VMH has been investigated, the relevance of JNK1 in this neuronal population has not been addressed. Here, we investigated the involvement of JNK1 SF1 on energy homeostasis.

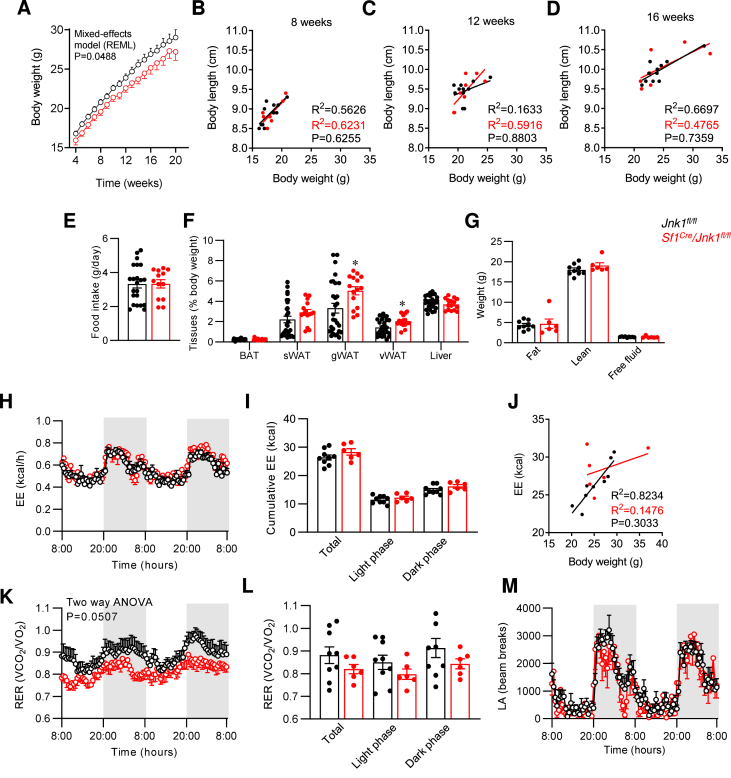
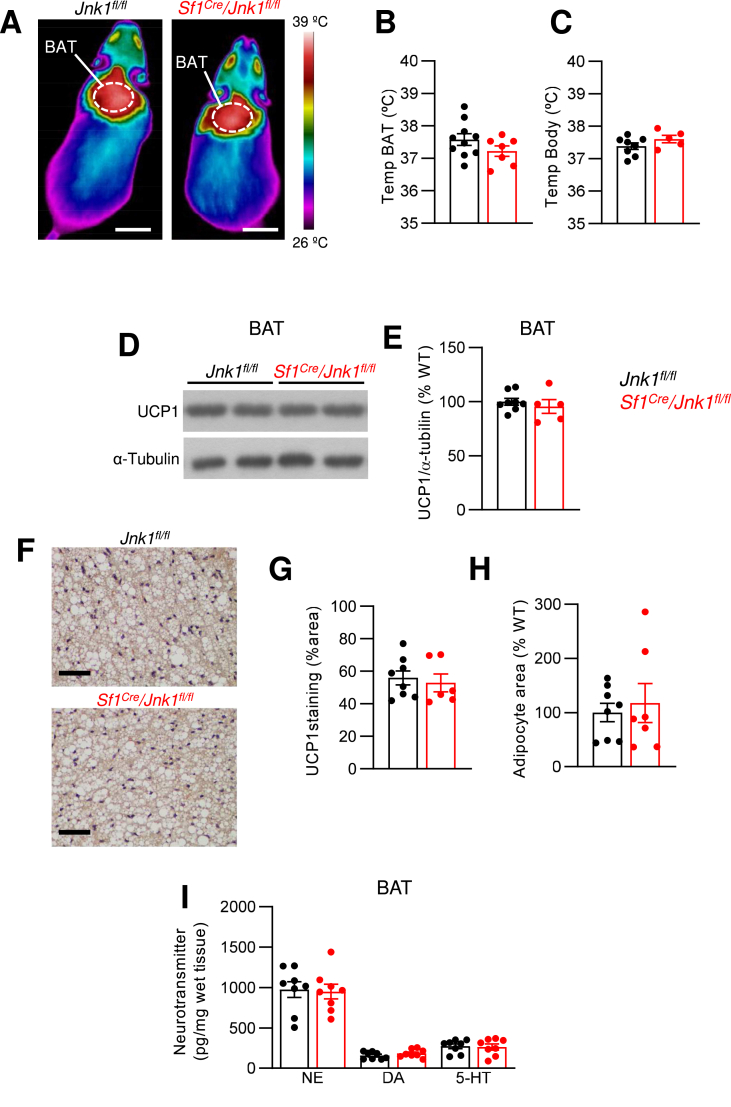
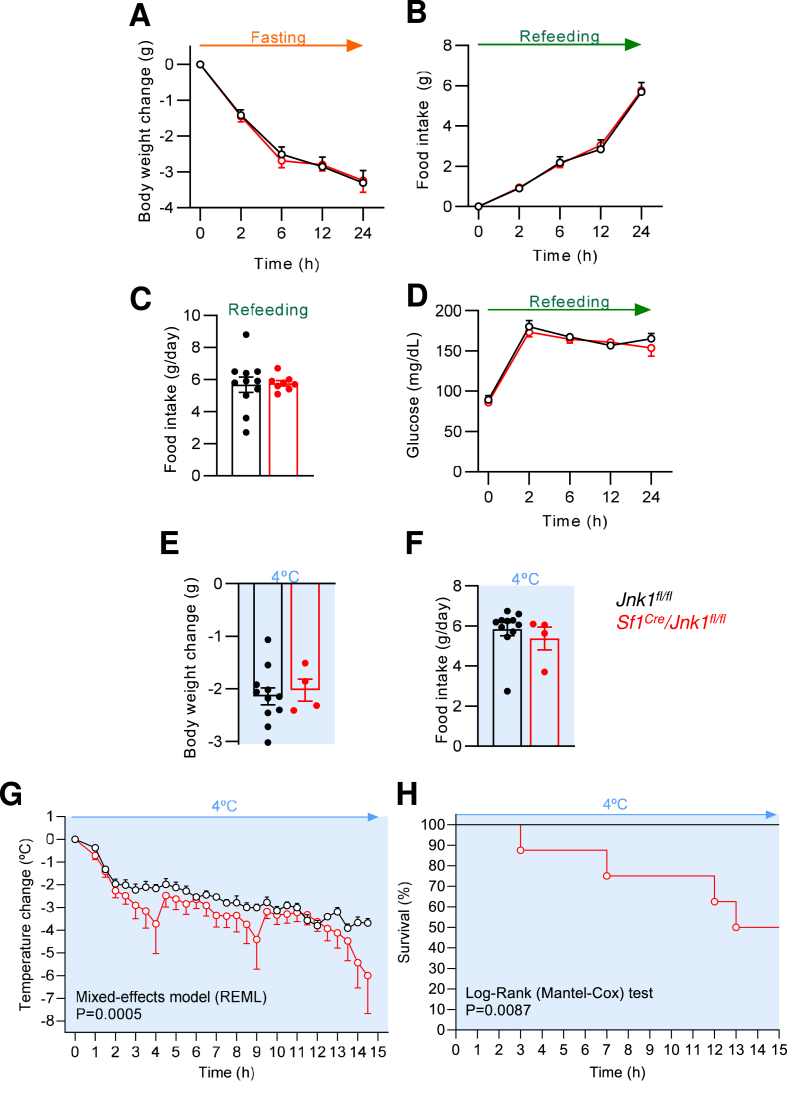
Methods: We generated mice bearing conditional JNK1 disruption through Mapk8 gene deletion in SF1 neurons (Sf1Cre/Jnk1fl/fl). Complete metabolic phenotyping, fasting/refeeding and cold challenges, as well as the central response to triiodothyronine (T3) on brown adipose tissue (BAT) thermogenesis and hepatic lipid metabolism were carried out.

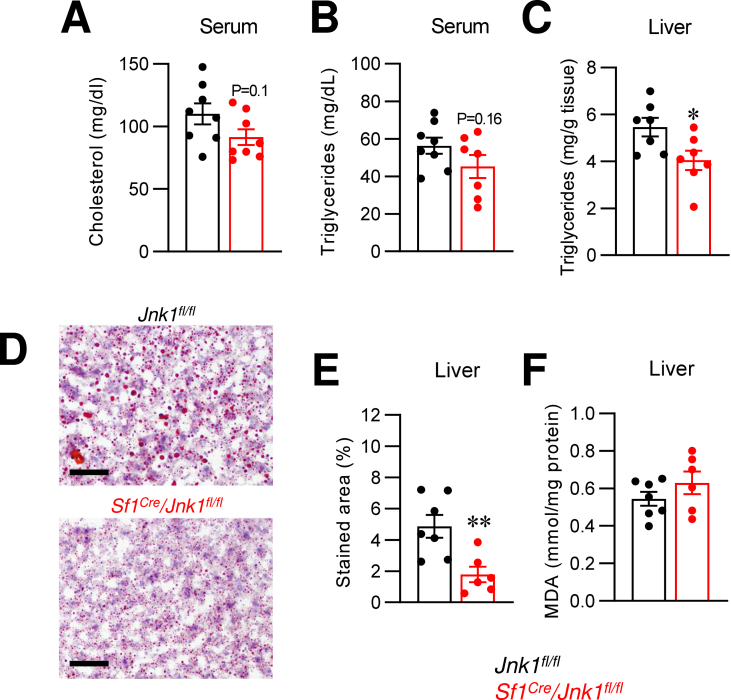
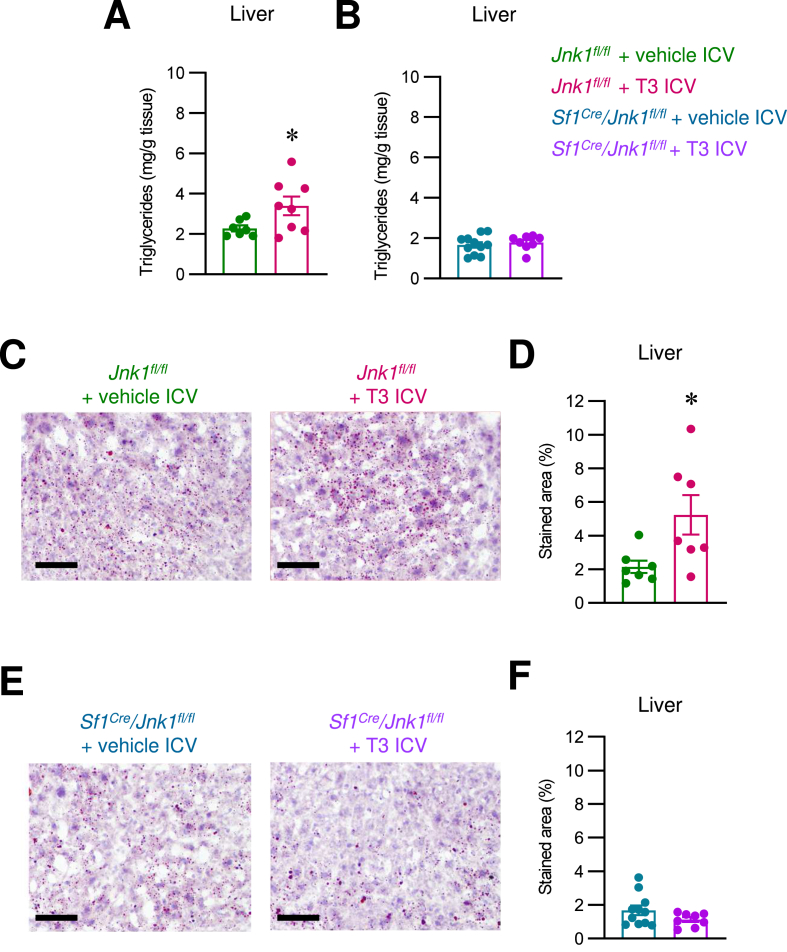
Results: Sf1Cre/Jnk1fl/fl mice displayed decreased body weight, improved glucose tolerance, and reduced hepatic lipid levels. However, Sf1Cre/Jnk1fl/fl did not properly defend their temperature upon cold exposure. While central administration of T3 elicited feeding independent weight loss in both wildtype (Jnk1fl/fl) and SF1Cre/Jnk1fl/fl mice, it did not promote hepatic lipid accretion in null animals.

Conclusions: Our data demonstrated for the first time that JNK1 in SF1 neurons is necessary for the regulation of hepatic lipid metabolism, cold adaptation and central T3 actions.

Keywords: BAT; Hypothalamus; JNK1; Liver; SF1; T3.


Conflict of interest statement

Declaration of competing interest Miguel López serves as Scientific Director of Gazella Biotech (https://gazellabiotech.com/). Rubén Nogueiras serves in the Advisory Board of Albor Biotech (https://alborbiotech.com/). The rest of the authors have no other conflicts of interest.

Figures

Figure 1
Figure 1
Genetic ablation of JNK1 in SF1 neurons. (A) Demonstration of Cre recombinase activity, as shown by the presence of red fluorescent td-Tomato in the VMH oftd-Tomato Sf1Cre/Jnk1fl/fl reporter mice but not control animals (20X; Scale bar: 100 μm). (B) Representative confocal images (40X; Scale bar: 100 μm). (C) % of JNK1 positive cells in the VMH (n = 18 mice/group), (D) % of JNK1 positive cells in the ARC (n = 10 mice/group), (E) JNK1 immunoreactivity (n = 8 mice/group), and (F)Jnk1 mRNA levels in the VMH (n = 5–6 mice/group) of Jnk1fl/fl and Sf1Cre/Jnk1fl/fl mice. Data are expressed as MEAN ± SEM. Statistical significance was determined by Student’s t-test; ∗P < 0.05, ∗∗P < 0.01 and ∗∗∗P < 0.001 vs. Jnk1fl/fl 3 V: third ventricle. (For interpretation of the references to colour in this figure legend, the reader is referred to the Web version of this article).
Figure 2
Figure 2
Effect of loss of JNK1 in SF1 neurons on energy balance. (A) Body weight (n = 26–39 mice/group), (B–D) correlation between body length and body weight (n = 7–11 mice group), (E) daily food intake (n = 13–22 mice/group), (F) tissues weight (n = 15–29 mice/group), (G) NMR analysis (n = 6–9 mice/group), (H) energy expenditure (EE) during dark and light phases (n = 6–9 mice/group, (I) cumulative EE (n = 6–9 mice/group, (J) ANCOVA analysis of EE using body weight as a covariate (n = 6–9 mice/group, (K) respiratory exchange ratio (RER) during dark and light phases (n = 6–9 mice/group, (L) average RER (n = 6–9 mice/group, and (M) spontaneous locomotor activity (LA) (n = 6–9 mice/group) of Jnk1fl/fl and Sf1Cre/Jnk1fl/fl mice. Data are expressed as MEAN ± SEM. Statistical significance was determined by two-way ANOVA (H, K and M), Linear regression (B–D), Mixed-effects model (A), ANCOVA (J) or Student’s t-test (E, F, G, I, and L); ∗P < 0.05 vs. Jnk1fl/fl.
Figure 3
Figure 3
Effect of loss of JNK1 in SF1 neurons on BAT thermogenesis. (A) Representative BAT thermographic images (scale bar: 1 cm), (B) temperature of BAT area (n = 7–10 mice/group), (C) body temperature (n = 5–8 mice/group), (D) representative immunoblot images, (E) densitometry quantification of UCP1 in BAT (n = 5–8 mice/group), (F) representative UCP1 staining in the BAT (40X; scale bar: 200 μm), (G) BAT UCP1 stained area (n = 6–8 mice/group), (H) adipocyte area (n = 7–8 mice/group) and (I) norepinephrine (NE), dopamine (DA) and serotonin (5-HT) levels in BAT (n = 8 mice/group) of Jnk1fl/fl and Sf1Cre/Jnk1fl/fl mice. In the western blot analyses values were expressed in relation to α-tubulin. Representative images for all proteins are shown, with all bands for each picture derived from the same gel. Data are expressed as MEAN ± SEM. Statistical significance was determined by Student’s t-test.
Figure 4
Figure 4
Effect of loss of JNK1 in SF1 neurons on glucose homeostasis. (A) Serum glucose levels (n = 9–17 mice/group), (B) glucose tolerance test (GTT) (n = 9–17 mice/group) and (C) area under the curve (AUC) (n = 9–17 mice/group), (D) insulin tolerance test (ITT) (n = 9–16 mice/group) and (E) AUC (n = 9–16 mice/group), (F) pyruvate tolerance test (PTT) (n = 6–9 mice/group) and (G) AUC (n = 6–9 mice/group) of Jnk1fl/fl and Sf1Cre/Jnk1fl/fl mice. Data are expressed as MEAN ± SEM. Statistical significance was determined by two-way ANOVA (B, D and F) or Student’s t-test (A, C, E, and G); ∗P < 0.05, ∗∗P < 0.01 and ∗∗∗P < 0.001 vs. Jnk1fl/fl; ###P < 0.001 vs. Fed.
Figure 5
Figure 5
Effect of loss of JNK1 in SF1 neurons on circulating and hepatic lipids. (A) Serum cholesterol levels (n = 8 mice/group), (B) serum triglyceride levels (n = 7–8 mice/group), (C) hepatic triglyceride levels (n = 7 mice/group) (D) representative microphotographs of Oil-Red O-staining (40X; scale bar: 50 μm), (E) hepatic lipid content in Oil Red O-stained sections (n = 6–7 mice/group) and (F) hepatic malondialdehyde (MDA) levels (n = 6–7 mice/group) of Jnk1fl/fl and Sf1Cre/Jnk1fl/fl mice. Data are expressed as MEAN ± SEM. Statistical significance was determined by Student’s t-test. ∗P < 0.05 and ∗∗P < 0.01 vs. Jnk1fl/fl. (For interpretation of the references to colour in this figure legend, the reader is referred to the Web version of this article).
Figure 6
Figure 6
Effect of loss of JNK1 in SF1 neurons on fasting/refeeding and cold exposure challenges.(A) Body weight change (n = 8–11 mice/group), (B and C) food intake (n = 8–11 mice/group) and (D) serum glucose levels (n = 8–11 mice/group) of Jnk1fl/fl and Sf1Cre/Jnk1fl/fl mice subjected to a 24-hour fasting period and subsequent 24-hour refeeding. (E) Body weight change (n = 8–11 mice/group; 4 out of 8 null mice died), (F) food intake (n = 8–11 mice/group; 4 out of 8 null mice died), (G) body temperature change (n = 8–11 mice/group; 4 out of 8 null mice died) and (H) % of survival (n = 8–11 mice/group; 4 out of 8 null mice died) of Jnk1fl/fl and Sf1Cre/Jnk1fl/fl mice cold exposed by 14.5 h. Data are expressed as MEAN ± SEM. Statistical significance was determined by two-way ANOVA (A, B and D), Mixed-effects model (G) or Student’s t-test (C, E and F).
Figure 7
Figure 7
Effect of loss of JNK1 in SF1 neurons on the central T3 action on body weight and BAT thermogenesis.(A) Serum T4 (n = 11 mice/group), (B) serum T3 (n = 9 mice/group), (C and E) Body weight change (C:n = 7–8 mice/group; E: 8–12 mice/group), (D and F) daily food intake (D:n = 7–8 mice/group; F: 8–12 mice/group), (G and I) representative BAT thermographic images, (H and J) temperature of BAT area (H:n = 6–7 mice/group; J: 6–12 mice/group), (K and M) representative immunoblot images (L and N) densitometry quantification of UCP1 in BAT (L:n = 7–8 mice/group; N: 8–9 mice/group) of Jnk1fl/fl and Sf1Cre/Jnk1fl/fl mice ICV treated with vehicle or T3. In the western blot analyses, values were expressed in relation to α-tubulin. Representative images for all proteins are shown, with all bands for each picture derived from the same gel, although they may be spliced for clarity (vertical black lines). Data are expressed as MEAN ± SEM. Statistical significance was determined by Student’s t-test (A, B, D, F, H, J, L and N) or two-way ANOVA (C and E;Supplementary Table 1) or ∗P < 0.05 and ∗∗P < 0.01 vs. Jnk1fl/fl.
Figure 8
Figure 8
Effect of loss of JNK1 in SF1 neurons on the central T3 action on hepatic lipids. (A and B) Hepatic triglyceride levels (A: n = 7–8 mice/group; B: n = 7–11 mice/group), (C and E) representative microphotographs of Oil-Red O-staining (40X; scale bar: 50 μm), (D and F) hepatic lipid content in Oil Red O-stained sections (D: n = 7 mice/group; F: n = 8–11 mice/group) of Jnk1fl/fl and Sf1Cre/Jnk1fl/fl mice ICV treated with vehicle or T3. Data are expressed as MEAN ± SEM. Statistical significance was determined by Student’s t-test or two-way ANOVA (Supplementary Table 1). ∗P < 0.05 vs. Jnk1fl/fl. (For interpretation of the references to colour in this figure legend, the reader is referred to the Web version of this article).

References

    1. Dragano N.R.V., Ferno J., Dieguez C., Lopez M., Milbank E. Recent updates on obesity treatments: available drugs and future directions. Neuroscience. 2020;447:191–215. - PubMed
    1. Muller T.D., Bluher M., Tschop M.H., DiMarchi R.D. Anti-obesity drug discovery: advances and challenges. Nat Rev Drug Discov. 2022;21(3):201–223. - PMC - PubMed
    1. Loos R.J.F., Yeo G.S.H. The genetics of obesity: from discovery to biology. Nat Rev Genet. 2022;23(2):120–133. - PMC - PubMed
    1. López M., Nogueiras R., Tena-Sempere M., Dieguez C. Hypothalamic AMPK: a canonical regulator of whole-body energy balance. Nat Rev Endocrinol. 2016;12(7):421–432. - PubMed
    1. Quarta C., Claret M., Zeltser L.M., Williams K.W., Yeo G.S.H., Tschop M.H., et al. POMC neuronal heterogeneity in energy balance and beyond: an integrated view. Nat Metab. 2021;3(3):299–308. - PMC - PubMed

LinkOut - more resources