. 2025 May 26;16(1):4641.
doi: 10.1038/s41467-025-59853-5.

Duplication of the autism-related gene Chd8 leads to behavioral hyperactivity and neurodevelopmental defects in mice

Affiliations

Duplication of the autism-related gene Chd8 leads to behavioral hyperactivity and neurodevelopmental defects in mice

Atsuki Kawamura et al. Nat Commun. .

Abstract

Mutations in the gene encoding chromodomain helicase DNA-binding protein 8 (CHD8) are strongly associated with autism spectrum disorder (ASD). Although duplications of the chromosomal locus including CHD8 have also been detected in individuals with neurodevelopmental disorders, the contribution of CHD8 duplication to clinical phenotypes and the underlying mechanisms have remained unknown. Here we show that Chd8 knock-in (KI) mice that overexpress CHD8 as a model of human CHD8 duplication manifest growth retardation, microcephaly, impaired neuronal differentiation, and behavioral abnormalities including hyperactivity and reduced anxiety-like behavior. Chd8 overexpression affects the transcription and chromatin accessibility of genes related to neurogenesis, with these changes being associated with aberrant binding of CHD8 to enhancer regions. Furthermore, pharmacological intervention partially ameliorates the hyperactivity of Chd8 KI mice. Our results thus indicate that Chd8 KI mice recapitulate key features of CHD8 duplication syndrome in humans, providing insight into pathogenic mechanisms underlying neurodevelopmental disorders.


Conflict of interest statement

Competing interests: The authors declare no competing interests.

Figures
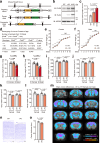
Fig. 1
Fig. 1. Chd8 KI mice manifest growth retardation and microcephaly.
a Schematic representation of the strategy to generate Chd8 KI mice. Ex, exon; SA, splice acceptor site; neo, neomycin resistance gene; pA, polyadenylation sequence; DT, diphtheria toxin gene. b, c Representative immunoblot (IB) analysis for whole brain at E14.5 (b), and quantification of CHD8 abundance (n = 4) (c). d Genotype frequencies produced from Chd8+/–;Chd8 KI mouse intercrosses. e, f Body weight for WT (n = 25) and Chd8 KI (n = 24) female mice (e) and for WT (n = 36) and Chd8 KI (n = 22) male mice (f) from 1 to 10 weeks of age. g, h Brain weight for WT (n = 3 female, 5 male), Chd8 KI (n = 6 female, 6 male), and KI/KI (n = 4 female, 6 male) mice at E14.5 (g) and for WT (n = 5 female, 7 male), Chd8 KI (n = 11 female, 17 male), and KI/KI (n = 5 female, 6 male) mice at E18.5 (h). i Brain weight for WT (n = 16 female, 30 male) and Chd8 KI (n = 15 female, 30 male) mice at 13–15 weeks of age. jl Total brain (j), gray matter (k), and white matter volume (l) for WT (n = 12) and Chd8 KI (n = 7) female mice and for WT (n = 13) and Chd8 KI (n = 13) male mice at 8 weeks of age. m Whole-brain voxel-wise comparisons for Chd8 KI mice (n = 7 female, 13 male) compared with WT mice (n = 12 female, 13 male). n, o Nissl staining of the somatosensory cortex (scale bars, 100 µm) at 10 weeks of age (n), and cortex thickness (n = 5) (o). All quantitative data are means ± s.e.m. See Supplementary Data 3. *P < 0.05, **P < 0.01, ***P < 0.001 (one-way ANOVA with Tukey’s post hoc test in (c); two-sided χ2 test in (d); two-way repeated-measures ANOVA with Tukey’s post hoc test in (e, f); Two-way factorial ANOVA with Tukey’s post hoc test in (gl); the unpaired two-sided Student’s t test in (o)).
Fig. 2
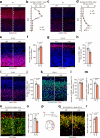
Fig. 2. Chd8 overexpression alters the proliferation and differentiation of NPCs.
ad Immunofluorescence staining of CUX1 (a) and CTIP2 (c) for the cortex of WT (n = 4 female, 2 male) and Chd8 KI (n = 3 female, 3 male) mice at P7, and distribution of the number of CUX1+ (b) and CTIP2+ cells (d). Nuclei were stained with 4′,6-diamidino-2-phenylindole (DAPI). eh Immunofluorescence staining of SOX2 (e) and TBR1 (g) for the lateral cortex of WT (n = 2 female, 3 male) and Chd8 KI (n = 3 female, 3 male) mice at E14.5, and quantification of SOX2+ (f) and TBR1+ (h) cells. i, j Immunofluorescence staining of TBR1 (i) and quantification of TBR1+ cells (j) for the lateral cortex of WT (n = 4 female, 2 male) and Chd8 KI (n = 2 female, 4 male) mice at E18.5. km Immunofluorescence staining of CTIP2 and SATB2 (k) and quantification of SATB2+ cells (l) and of CTIP2+ cells (m) for the lateral cortex of WT (n = 3 female, 3 male) and Chd8 KI (n = 4 female, 2 male) mice at E18.5. n, o Immunofluorescence staining of Ki67 and EdU labeling (n) as well as quantification of Ki67EdU+ cells (o) in the lateral cortex of WT (n = 1 female, 5 male) and Chd8 KI (n = 2 female, 4 male) mice at 24 h after pulse-labeling with EdU at E12.5. pr Schematic diagram for cell-cycle analysis by pulse-labeling with EdU and BrdU at E12.5 (p) as well as subsequent immunofluorescence staining of BrdU and EdU labeling (q), and quantification of BrdUEdU+ cells (r) for the lateral cortex of WT (n = 3 female, 3 male) and Chd8 KI (n = 4 female, 2 male) mice. Scale bars, 100 µm for (a, c), 50 µm for (e, g, i, k), 20 µm for (n, q). All quantitative data are means ± s.e.m. See Supplementary Data 3 for more detailed statistics. *P < 0.05, **P < 0.01, ***P < 0.001 (two-way repeated-measures ANOVA with Tukey’s post hoc test in (b, d); the unpaired two-sided Student’s t test in (f, h, j, l, m, o, r)).
Fig. 3
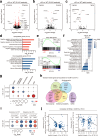
Fig. 3. Chd8 overexpression alters the expression of neurodevelopmental and disease-related genes.
ac Volcano plots for DEGs identified using DESeq2 in the forebrain at E14.5 (a) or E18.5 (b), as well as in the cortex at 8 weeks of age (c) of WT and Chd8 KI male mice (n = 5 mice per genotype). DEGs (FDR-adjusted P value of <0.05 by the Benjamini–Hochberg method) are shown in red. Genes with a |log2(fold change)| > 0.58 and an FDR-adjusted P value of <0.05 are indicated with orange dots, and their names are highlighted. Source data are provided in Supplementary Data 1. d GO analysis of genes whose expression was up- or downregulated in the forebrain of Chd8 KI mice at E14.5 (unadjusted P value). e, f GSEA plots of early-fetal and midfetal gene sets (e) and cell-type-specific gene sets (f) for the forebrain of Chd8 KI mice compared with that of WT mice at E14.5. NES, normalized enrichment score. g GSEA for disease-related gene sets in the forebrain at E14.5 and E18.5 as well as in the cortex at 8 weeks of age of Chd8 KI mice compared with WT mice. h Venn diagram showing the overlap of disease-related genes among DEGs in (a). i GSEA for up- or downregulated gene sets identified from Chd8+/– brain at E14.5 or E18.5 as examined in the forebrain of Chd8 KI mice compared with WT mice at E14.5 and E18.5. Up- and downregulated genes identified in the whole brain of Chd8+/– mice at E14.5 and E18.5 (ref. ), as well as those identified in the forebrain of Chd8+/– mice at E14.5 (ref. ) were used as gene sets. j Pearson correlation analysis (two-sided) for DEGs in the forebrain of Chd8 KI mice compared with WT mice as in (a) and the corresponding genes in the brain of Chd8+/– mice, compared with Chd8+/+ mice at E14.5. Genes included in the various gene sets are shown in Supplementary Data 2. The significance levels for P and FDR q values are indicated by ** for <0.01 and *** for <0.001.
Fig. 4
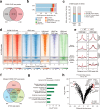
Fig. 4. Aberrant binding of CHD8 to enhancer regions and increased chromatin accessibility in the embryonic forebrain of Chd8 KI mice.
a Venn diagram showing the overlap of CHD8 ChIP-seq peaks between the WT and Chd8 KI mouse forebrain at E14.5. CHD8 peaks were identified with a peak-calling threshold of unadjusted P < 1 × 10–12 using MACS. The results for a more stringent peak-calling threshold (unadjusted P < 1 × 10–18) are shown in Supplementary Fig. 5b–d. b Composition of CHD8 binding peaks determined by ChIP-seq analysis in the forebrain of WT and Chd8 KI mice at E14.5. Promoter is defined as the region spanning –1 to +1 kb relative to the TSS. UTR, untranslated region. c Binding of CHD8 to the TSS of DEGs identified for the forebrain of Chd8 KI versus WT mice at E14.5 by RNA-seq analysis (Fig. 3a). d, e Heat map clustering (d) and signal density (e) for CHD8 ChIP-seq and ATAC-seq data derived from the forebrain of WT and Chd8 KI mice at E14.5. H3K4me3, H3K27ac, and H3K4me1 ChIP-seq peaks for the WT mouse forebrain at E14.5 derived from the ENCODE project are also shown. The region spanning 3 kb upstream to 3 kb downstream of the center of CHD8 binding peaks is presented. f Venn diagram showing overlap between merged CHD8 binding peaks (19,735 peaks) in the forebrain of WT and Chd8 KI mice and ATAC-seq peaks in the forebrain of WT (37,091 peaks) and Chd8 KI (59,077 peaks) mice at E14.5. g GO analysis using GREAT for genes related to gained ATAC-seq peaks (341 peaks) in Chd8 KI mice compared with WT mice (unadjusted P < 0.01). No significant enrichment was observed for genes related to lost ATAC-seq peaks in Chd8 KI mice. h Differential transcription factor (TF) footprinting analysis using TOBIAS of ATAC-seq signals in the forebrain of Chd8 KI versus WT mice at E14.5. Binding motifs (differential binding score of >0.2 or <–0.2) are highlighted in red.
Fig. 5
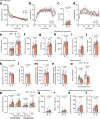
Fig. 5. Chd8 KI mice manifest hyperactivity and decreased anxiety-like behavior.
ad Distance traveled (a), time spent in center (b), latency to enter the central area (c), and vertical activity (d) for 11- to 12-week-old Chd8 KI (n = 20) and WT (n = 19) male mice in the open-field test. eg Distance traveled in the light and dark chambers (e), time spent in the light chamber (f), and number of transitions between chambers (g) for 11-week-old male mice in the light-dark transition test (n = 20). hj Distance traveled (h), time spent in the open arms (i), and number of entries into the open arms (j) for the elevated plus-maze test performed with 12-week-old Chd8 KI (n = 18) and WT (n = 20) male mice. k, l Total duration of contacts (k) and number of contacts (l) for the social-interaction test performed with Chd8 KI (n = 9) and WT (n = 8) male mice at 12 weeks of age. m, n Social preference index for the three-chamber test of sociability (m) or social novelty (n) performed with Chd8 KI (n = 20) and WT (n = 19) male mice at 13 weeks of age. o, p Acoustic startle response to stimuli of 110 or 120 dB (o) as well as inhibition of the startle response by prepulses of 74 or 78 dB (p) for 12-week-old Chd8 KI (n = 20) and WT (n = 19) male mice. q, r Distance traveled (q) and latency (r) to reach the target hole during the probe trial of the Barnes maze test at 53–54 weeks of age (n = 18). s, t Distance traveled (s) and latency (t) to reach the new target hole in the reversal probe trial of the Barnes maze test at 57 to 60 weeks of age (n = 17). All data are means ± s.e.m. *P < 0.05, **P < 0.01, ***P < 0.001 (two-way repeated-measures ANOVA with Tukey’s post hoc test in (a, b, d); the unpaired two-sided Student’s t test in (c, et)). See Supplementary Data 3 for more detailed statistics.
Fig. 6
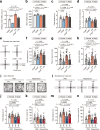
Fig. 6. Risperidone treatment partially rescues the behavioral hyperactivity of Chd8 KI mice.
a RT and real-time PCR analysis of Chd8 mRNA in the brain of WT (n = 5), Chd8+/– (n = 5), Chd8 KI (n = 7), and Chd8+/–;Chd8 KI (n = 4) mice at E14.5. b Brain weight for adult mice of the indicated genotypes at 14–24 weeks of age. c, d Distance traveled (c) and mean duration of contacts (d) for the social-interaction test performed with mice of the indicated genotypes at 11–20 weeks of age. eh Representative traces (e), distance traveled (f), time in the open arms (g), and number of entries into the open arms (h) for the elevated plus-maze test performed with mice of the indicated genotypes at 11–20 weeks of age. Data in (bh) are for 18 females and 23 males of WT, Chd8+/–, and Chd8+/–;Chd8 KI mice as well as for 18 females and 24 males of Chd8 KI mice. ik Representative traces (i), distance traveled (j), and time spent in center (k) for the open-field test performed with WT and Chd8 KI mice at 9–16 weeks of age, treated with phosphate-buffered saline (PBS) vehicle or risperidone. ln Representative traces (l), distance traveled (m), and time spent in the open arms (n) for the elevated plus-maze test performed with WT or Chd8 KI mice at 9–16 weeks of age, treated with vehicle or risperidone. Data in (in) are obtained from WT (n = 19 female, 17 male for vehicle; n = 19 female, 18 male for risperidone) and Chd8 KI mice (n = 17 female, 18 male for vehicle; n = 18 female, 18 male for risperidone). All quantitative data are means ± s.e.m. *P < 0.05, **P < 0.01, ***P < 0.001 (one-way ANOVA with Tukey’s post hoc test in (a); two-way ANOVA with Tukey’s post hoc test in (bd, fh); three-way factorial ANOVA with Tukey’s post hoc test in (j, k, m, n)). See Supplementary Data 3 for more detailed statistics.

Similar articles

References

    1. Coe, B. P. et al. Neurodevelopmental disease genes implicated by de novo mutation and copy number variation morbidity. Nat. Genet.51, 106–116 (2019). - PMC - PubMed
    1. Satterstrom, F. K. et al. Large-scale exome sequencing study implicates both developmental and functional changes in the neurobiology of autism. Cell180, 568–584 e523 (2020). - PMC - PubMed
    1. Parenti, I., Rabaneda, L. G., Schoen, H. & Novarino, G. Neurodevelopmental disorders: from genetics to functional pathways. Trends Neurosci.43, 608–621 (2020). - PubMed
    1. Cook, E. H. Jr & Scherer, S. W. Copy-number variations associated with neuropsychiatric conditions. Nature455, 919–923 (2008). - PubMed
    1. Grayton, H. M., Fernandes, C., Rujescu, D. & Collier, D. A. Copy number variations in neurodevelopmental disorders. Prog. Neurobiol.99, 81–91 (2012). - PubMed

MeSH terms