. 2025 May 26;16(1):415.
doi: 10.1038/s41419-025-07739-1.

The TP53 Arg72Pro polymorphism predicts visual and neurodegenerative outcomes in retinal detachment

Affiliations

The TP53 Arg72Pro polymorphism predicts visual and neurodegenerative outcomes in retinal detachment

Nadia Galindo-Cabello et al. Cell Death Dis. .

Abstract

Retinal detachment (RD) separates the retina from the retinal epithelium, causing photoreceptor apoptosis and irreversible vision loss. Even with successful surgical reattachment, complete visual recovery is not guaranteed. The TP53 Arg72Pro polymorphism, implicated in apoptosis, has emerged as a potential predictor of RD outcomes. We investigated the impact of the Arg72Pro polymorphism on retinal neurodegeneration and functional recovery in patients. The underlying mechanisms were analyzed in a humanized TP53 Arg72Pro RD mouse model. In a cohort of 180 patients, carriers of the Pro allele exhibited decreased apoptotic gene expression and improved visual recovery. Complementary findings in mice revealed that the Pro variant preserved photoreceptor integrity and reduced apoptosis rates following RD. Our findings highlight the potential of this TP53 polymorphism as a biomarker for RD outcomes and a tool for tailoring therapies. This study underscores the importance of integrating genetic profiling into personalized medicine approaches to improve recovery of RD patients' visual outcomes.


Conflict of interest statement

Competing interests: The authors declare no competing interests.

Figures

Fig. 1
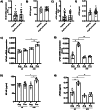
Fig. 1. The TP53 codon 72 polymorphism (Arg72Pro) is associated with functional outcomes after RD.
A Kaplan–Meier curves illustrate the time until surgery for two genotype groups: Arg/Arg (blue line) and Arg/Pro + Pro/Pro (orange line). The x-axis represents the days until surgery is performed. The Arg/Arg group is more likely to enter surgery earlier than the Arg/Pro + Pro/Pro group. Shaded areas represent the confidence intervals for each curve. B Ridge Regression Coefficients for Predicting HRDs. Estimated coefficients from the Ridge regression model predicting the likelihood of HRDs. Each bar represents the coefficient value for the independent variables included in the model: genotype (Arg/Arg vs Arg/Pro + Pro/Pro), baseline morphological stage in OCT, symptom duration (≤10 days vs >10 days), and macular edema (present vs absent). The coefficients indicate each variable’s contribution to the likelihood of exhibiting hyperreflective points. C Box plot of final BCVA in LogMAR by genotype (Arg/Arg vs. Arg/Pro + Pro/Pro), based on coefficients from a linear regression model on final BCVA LogMAR. The Arg/Pro + Pro/Pro group showed a slightly better final BCVA, with a genotype coefficient of −0.168 (p = 0.026, 95% CI: [−0.32, −0.02]), suggesting a modest visual advantage compared to the Arg/Arg group. Individual points outside the whiskers indicate outliers. This data highlights the potential impact of genotype on visual recovery outcomes. D Interaction effects of genotype, foveal status, and surgical timing on final BCVA LogMAR with 95% confidence intervals and p-values. The graph illustrates visual acuity (LogMAR) variations across combinations of genotype (Arg/Arg vs. Arg/Pro + Pro/Pro), foveal status (ON vs. OFF), and surgical timing (≤7 days vs. >7 days).
Fig. 2
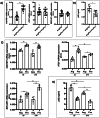
Fig. 2. The Arg72-p53 variant is associated with the activation of apoptotic cell death after RD.
A Relative quantification of BAX, CASP9, and CASP3 gene mRNA expression in human retinal samples. B Quantification of CASP3 protein in human retinal samples. C Relative quantification of BAX, CASP9, and CASP3 gene mRNA expression in animal model retinas 3 and 10 days after RD. D Quantification of CASP3 protein in animal model retinas at 3 and 10 days after RD. E TUNEL assay in animal model retinas 3 and 10 days after RD, scale bar: 75 μm. F Quantification of positive nuclei in TUNEL assay in retinas of the animal model, at 3 and 10 days after RD. ONL outer nuclear layer, INL inner nuclear layer, GCL ganglion cell layer, *P < 0.05, **P < 0.01, ***P < 0.001, AU arbitrary units. Bars represent mean values and their respective standard deviation.
Fig. 3
Fig. 3. The Pro72-p53 variant is related to increased inflammation after retinal RD.
A Relative quantification of mRNA expression of IL-1, IL-6, and TGFb genes in human retinal samples. B Quantification of IL-6 and TGFb proteins from human retinal samples. C Relative quantification of mRNA expression of IL-1, IL-6, and TGFb genes in animal model retinas at 3 and 10 days after RD. D Quantifying IL-6 and TGFb proteins in animal model retinas 3 and 10 days after RD. E Relative quantification of mRNA expression of GFAP and C100b genes in human retinal samples. F Immunoreactivity of GFAP in animal model retinas at 3 and 10 days after RD, scale bar: 75 μm. G Relative quantification of C100b gene mRNA expression in animal model retinas 3 and 10 days after RD. ONL outer nuclear layer, INL inner nuclear layer, GCL ganglion cell layer, *P < 0.05, **P < 0.01, ***P < 0.001, AU arbitrary units. Bars represent mean values and their respective standard deviation.
Fig. 4
Fig. 4. NF-kB and cFos expression could be determined by TP53 Arg72Pro polymorphism after RD.
A Relative quantification of mRNA expression of NF-kB gene in human retinal samples. B Quantification of NF-kB protein in human retinal samples. C Relative quantification of mRNA expression of NF-kB gen in animal model retinas at 3 and 10 days after RD. D Quantifying NF-kB protein in animal model retinas 3 and 10 days after RD. E Relative quantification of mRNA expression of cFos gene in human retinal samples. F Quantification of cFOS protein in human retinal samples. G Relative quantification of mRNA expression of cFOS gen in animal model retinas at 3 and 10 days after RD. H Quantifying cFOS protein in animal model retinas 3 and 10 days after RD. *P < 0.05, **P < 0.01, ***P < 0.001. AU arbitrary units. Bars represent mean values and their respective standard deviation.
Fig. 5
Fig. 5. The TP53 Arg72Pro polymorphism is involved in the autophagy modulation after RD.
A Relative quantification of mRNA expression of SQSTM1, ATG7, and BECLIN1 genes in human retinal samples. B Quantification of p62 protein in human retinal samples. C Relative quantification of mRNA expression of SQSTM1, ATG7, and BECLIN1 genes in animal model retinas at 3 and 10 days after RD. D Quantifying p62 protein in animal model retinas 3 and 10 days after RD. *P < 0.05, **P < 0.01, ***P < 0.001. AU arbitrary units. Bars represent mean values and their respective standard deviation.
Fig. 6
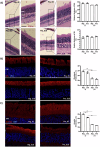
Fig. 6. Influence of TP53 Arg72Pro polymorphism in the photoreceptor morphology after RD.
A Hematoxylin-Eosin (H-E) stained section from animal model retinas at 3 and 10 days after RD, scale bar: 25 μm. B Immunoreactivity of rhodopsin (Rho) from animal model retinas at 3 and 10 days after RD, scale bar: 10 μm. C Immunoreactivity of cone arrestin from animal model retinas 3 and 10 days after RD, scale bar: 50 μm. *P < 0.05, **P < 0.01, ***P < 0.001, ONL outer nuclear layer, INL inner nuclear layer, GCL ganglion cell layer.
Fig. 7
Fig. 7. Analysis of apoptosis, inflammation, and autophagy according to the TP53 Arg72Pro polymorphism and the macula status after RD.
A Relative quantification of BAX, CASP9, and CASP3 gene mRNA expression in human retinal samples. B Quantification of CASP3 protein in human retinal samples. C Relative quantification of mRNA expression of IL-1, IL-6, and TGFb genes in human retinal samples. D Quantification of IL-6 protein in human retinal samples. E Relative quantification of mRNA expression of SQSTM1, ATG7, and BECLIN1 genes in human retinal samples. F Quantification of p62 protein in human retinal samples. *P < 0.05, **P < 0.01, ***P < 0.001. AU arbitrary units. Bars represent mean values and their respective standard deviation.

References

    1. Lin JB, Narayanan R, Philippakis E, Yonekawa Y, Apte RS. Retinal detachment. Nat Rev Dis Primers. 2024;10:18. - PubMed
    1. Mitry D, Fleck BW, Wright AF, Campbell H, Charteris DG. Pathogenesis of rhegmatogenous retinal detachment: predisposing anatomy and cell biology. Retina. 2010;30:1561–72. - PubMed
    1. Mitry D, Awan MA, Borooah S, Syrogiannis A, Lim-Fat C, Campbell H, et al. Long-term visual acuity and the duration of macular detachment: findings from a prospective population-based study. Br J Ophthalmol. 2013;97:149–52. - PubMed
    1. Put MAJ, van de, Hoeksema L, Wanders W, Nolte IM, Hooymans JMM, et al. Postoperative vision-related quality of life in macula-off rhegmatogenous retinal detachment patients and its relation to visual function. PLoS ONE. 2014;9:e114489. - PMC - PubMed
    1. Pastor JC, Rojas J, Pastor-Idoate S, Di Lauro S, Gonzalez-Buendia L, Delgado-Tirado S. Proliferative vitreoretinopathy: a new concept of disease pathogenesis and practical consequences. Prog Retin Eye Res. 2016;51:125–55. - PubMed

Substances