. 2025 May 26;16(1):4230.
doi: 10.1038/s41467-025-59342-9.

Cortical circuits for cross-modal generalization

Affiliations

Cortical circuits for cross-modal generalization

Maëlle Guyoton et al. Nat Commun. .

Abstract

Adapting goal-directed behaviors to changing sensory conditions is a fundamental aspect of intelligence. The brain uses abstract representations of the environment to generalize learned associations across sensory modalities. The circuit organization that mediates such cross-modal generalizations remains, however, unknown. Here, we demonstrate that mice can bidirectionally generalize sensorimotor task rules between touch and vision by using abstract representations of peri-personal space within the cortex. Using large-scale mapping in the dorsal cortex at single-cell resolution, we discovered multimodal neurons with congruent spatial representations within multiple associative areas of the dorsal and ventral streams. Optogenetic sensory substitution and systematic silencing of these associative areas revealed that a single area in the dorsal stream is necessary and sufficient for cross-modal generalization. Our results identify and comprehensively describe a cortical circuit organization that underlies an essential cognitive function, providing a structural and functional basis for abstract reasoning in the mammalian brain.


Conflict of interest statement

Competing interests: The authors declare no competing interests.

Figures

Fig. 1
Fig. 1. Cross-modal generalization in mice.
a Illustration of the common organization of the peri-personal space for visual and whisker tactile inputs in mice. b Schematic of the behavioral Go/No go paradigm for studying cross-modal generalization of spatial information in mice. c Two types of tactile-to-visual modality switches: “rule-preserving”, wherein the spatial location of rewarded stimuli is preserved, and “rule-reversing”, wherein the location of rewarded stimuli is reversed. d Left: example of a session with the tactile task the day before modality switch. Conditional lick probabilities over trials are shown for the top whisker (blue), the bottom whisker (red) and in absence of stimuli (purple). Task performance (green) is computed as the percentage of correct discrimination trials (see “Methods“). Chance level is shown as a gray dashed line. Traces were computed on a sliding window of 60 trials. Right: same as left for the first visual session following a rule-preserving modality switch. e Left: task performance and conditional lick probabilities averaged across mice (N = 5 mice) over three consecutive sessions before and after a rule-preserving switch (vertical dashed line). Shaded area: S.E.M. Color code as in panel d. Right: detection (purple) and discrimination (green) performance distribution for the session before and after the switch (two-sided paired t test comparing days, Det.: N.S. p = 1; Discr.: N.S. p = 0.96). Performances are also tested against chance level (two-sided t test, Det.: ***p = 4.4 × 10–4 and ***p = 1.4 × 10–7; Discr.: ***p = 2.8 × 10–4 and ***p = 4.7 × 10–4). Error bars: S.E.M. Discrimination performance indicates the proportion of trials in which mice correctly responded to top and bottom stimuli. Detection performance indicates the proportion of trials in which mice differentiated any stimulus (top or bottom) from no stimulus at all (see “Methods“). f, g Same as in panels d-e but for a rule-reversing modality switch (two-sided paired t test comparing days, Det.: ***p = 1.2 × 10–5; Discr.: **p = 0.005). Performances are also tested against chance level (two-sided t test,Det.: ***p = 4.6 × 10–4 and *p = 0.03; Discr.: **p = 0.003 and Blank p = 0.29).
Fig. 2
Fig. 2. Bidirectional cross-modal generalization of spatial information.
a Schematic of the behavioral paradigm where switches occur between an auditory discrimination task with two pure tones (6 kHz and 12 kHz) and a visual task. The 6 kHz tone only is associated with a water reward. b Left: Average task performance and conditional lick probabilities across sessions for mice (N = 5 mice) undergoing a modality switch (dashed vertical line). Shaded areas and color code as in Fig. 1e. Right: detection (purple) and discrimination (green) performance distribution for the session before and after the switch (two-sided paired t test comparing days, Det.: ***p = 1.2 × 10–7; Discr.: ***p = 6.6 × 10–5). Performances are also tested against chance level (two-sided t test, Det.: ***p = 4.8 × 10–5 and *p = 0.031; Discr.: ***p = 4.4 × 10–5 and Blank p = 0.59). Error bars: S.E.M. c Comparison of relearning rates between mice that underwent a rule-reversing tacto-visual modality switch and mice that underwent switch from a non-spatial auditory task to the same visual task (N = 10 mice for tactile group and N = 10 mice for auditory group, unpaired two-sided t test, *p = 0.02). Error bars: S.E.M. d Schematic of the behavioral paradigm, where switches occur between a visual task and a tactile task with the top visual stimulus being the rewarded one. e Same as panel b for mice undergoing a rule-preserving switch (N = 5 mice, two-sided paired t test comparing days, Det.: N.S. p = 0.16; Discr.: N.S. p = 0.29). Performances are also tested against chance level (two-sided t test, Det.: ***p = 2.3 × 10–4 and *p = 0.029; Discr.: ***p = 3.5 × 10–4 and *p = 0.03). f Same as panel b but for a rule-reversing modality switch (N = 5 mice, two-sided paired t test comparing days, Det.: ***p = 7 × 10–9; Discr.: ***p = 7.2 × 10–5). Performances are also tested against chance level (two-sided t test, Det.: ***p = 3.6 × 10–6 and Blank p = 0.098; Discr.: ***p = 2.9 × 10–5 and Blank p = 0.2). g Comparison of average task performance in the tactile and visual tasks before (pre) or after (post) modality switches across mice (sample size indicated in the bar plot). Only mice that underwent rule-preserving switches were included after the switch (two-sided unpaired Wilcoxon test, *p = 0.04, ***p = 2.3 × 10–6, N.S. Not significant p = 0.22). Error bars: S.E.M.
Fig. 3
Fig. 3. Co-aligned visual and tactile functional maps in the dorsal cortex.
a Top: schematic of the visuo-tactile sparse noise protocol used during wide-field imaging of GCaMP6f-expressing mice through a cranial window. Bottom: matrix of all combinations of visual and whisker stimuli (green: multisensory, orange: visual, magenta: tactile). b Somatotopic map of vertical space computed from whisker stimuli averaged across mice (N = 29 mice for all panels of the figure), with transparency defined by response significance in each pixel (see “Methods”). A projection of the Allen Mouse Brain Atlas is overlaid on top with areas names and orientation. c Average retinotopic map of vertical space. d Average modality preference map between visual and tactile responses. e Average spatial coherence map between visual and tactile representations (see “Methods”). f Average multisensory modulation map comparing visuo-tactile responses and combination of unisensory responses (see “Methods”). g Multisensory modulation index for pixels belonging in regions of high spatial coherence compared to regions without spatial coherence (n = 26,286 pixels versus n = 28,394 pixels, unpaired two-sided Wilcoxon test, ***p < 10–300). h Multisensory modulation index for pixels belonging to unimodal or multimodal regions (n = 10,264 pixels versus n = 15,921 pixels, unpaired two-sided Wilcoxon, ***p < 10–116). Violin plots show the data distribution (the violin outline), while the overlaid box indicates the median (center line), interquartile range (bounds of the box), and 1.5× interquartile range (whiskers).
Fig. 4
Fig. 4. Co-aligned visual and tactile anatomical projection maps in the dorsal cortex.
a Schematic of the data collection and analysis pipeline for topographic anatomical tracing. b Anterograde labeling of S1 projections using injections of viral vectors AAV-CAG-GFP and AAV-CAG-tdTomato. Left: injection sites in B2 and C2 barrels in whisker S1. Right: conserved somatotopic organization of projections in associative areas for the cortex shown on the left (top). Bottom: Reconstructed whisker preference averaged across mice using all injection sites depicted by circles (see “Methods”, N = 9 mice and n = 18 injections, Pearson coefficient of correlation between anatomical and wide-field map: 0.8311, two-sided t test p < 10–300). c Same as panel b but for anterograde labeling of V1 projections with two injection sites along the iso-horizontal axis (N = 7 mice and n = 14 injections, Pearson coefficient of correlation: 0.5121, two-sided t test p < 10–300). d Retrograde labeling of S1-projecting neurons using CTB-Alexa 555 and CTB-Alexa 647 injections. Top: Examples of CTB-labeled neurons spatially organized in associative areas. Bottom: Reconstructed map of preferred whisker in projecting neurons over the dorsal cortex combining all injection sites (N = 5 mice and n = 8 injections, Pearson coefficient of correlation: 0.663, two-sided t test p < 10–300).
Fig. 5
Fig. 5. Visuo-tactile representation of peri-personal space in single neurons.
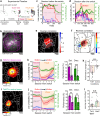
a Cranial window and two-photon field-of-view overlapping with area RL. b Response pattern of GCaMP6f for the neuron highlighted in panel a (yellow circle). Unisensory z-scored responses for visual (orange) or whisker (magenta) stimuli. Predicted multisensory responses are shown for visuo-tactile stimuli (black) together with measured responses (green). Shaded areas: S.E.M. c Single neurons with significant responses to whisker stimuli (n = 567 neurons, N = 25 mice). Color code indicates preference for top (blue) or bottom (red) stimuli. Reconstructed wide-field map in the background (see “Methods”, Pearson coefficient of correlation: 0.8472, two-sided t test p < 10–300). d Same as panel c for neurons significantly responding to visual stimuli (n = 1593 neurons, Pearson coefficient of correlation: 0.6505, two-sided t test p < 10–300). e Distribution of all visuo-tactile bimodal neurons. Neurons are classified as part of the ventral (green) or dorsal (pink) pathway depending on their location (see “Methods”). Neurons outside these pathways in gray. f Distribution of responsive neurons color-coded by their visual decoding accuracy, following training with whisker-stimulation responses (see “Methods”, N = 2563 neurons, N = 25 mice). g Comparison of preferred visual position and preferred whisker in visuo-tactile stimulations condition for predicted (open circles) and measured (full circles) responses of ventral neurons (n = 75 significantly responsive multimodal neurons, Pearson coefficient of correlation: 0.36 for predicted with two-sided t test p = 1.6 × 10–3 and 0.48 for measured with two-sided t test p = 1.5 × 10–5; 77% of neurons in congruent quadrants) and dorsal neurons (n = 124 significantly responsive multimodal neurons, Pearson coefficient of correlation: 0.55 for predicted with two-sided t test p = 3.7 × 10–11 and 0.47 for measured with two-sided t test p = 4.3 × 10–8; 71% of neurons in congruent quadrants). h Comparison between tactile and visual tuning indices computed from the predicted (open circles) or measured (full circles) visuo-tactile responses of neurons in panel e. i Comparison of the visual tuning indices from panel h between predicted and measured responses for ventral and dorsal stream neurons (two-sided paired Wilcoxon test between measured and predicted for ventral: n = 75 neurons, ***p = 1.7 × 10–5; for dorsal: n = 124 neurons, ***p = 3.1 × 10–11; two-sided unpaired t test comparing dorsal and ventral measured responses: ***p = 3.2 × 10–5). j Same as panel i for the tactile tuning indices (two-sided paired Wilcoxon test between measured and predicted for ventral: n = 75 neurons, ***p = 7.7 × 10–10; for dorsal: n = 124 neurons, ***p = 1.6 × 10–19; two-sided unpaired t test comparing dorsal and ventral measured responses: ***p = 1.1 × 10–5). Violin plots show the data distribution (the violin outline), while the overlaid box indicates the median (center line), interquartile range (bounds of the box), and 1.5× interquartile range (whiskers).
Fig. 6
Fig. 6. Area RL is necessary for cross-modal generalization.
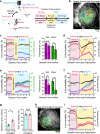
a Schematic timeline for loss-of-function experiments. b Cranial window with TeNT-P2A-GFP expression and atlas overlaid. c Example session before a rule-preserving modality switch from a tactile to a visual task. Color code as in Fig. 1d. d Session following the modality switch. e Area-based correlation between TeNT-P2A-GFP expression overlap and performance drop following modality switch. Color map indicates Pearson coefficients of correlation ρ. Areas with p < 0.05 are indicated with a thick border (RL: two-sided t test p = 0.047). f Average TeNT-P2A-GFP coverage for mice with impaired cross-modal generalization (see “Methods”). The map is displayed after subtraction of the average coverage across all injected mice. g Average TeNT-P2A-GFP coverage of mice where only dorsal neurons were silenced (N = 8 mice). Dots indicate center-of-mass location for each mouse. h Left: Average task performance and conditional lick probabilities across sessions for mice in panel g with rule-preserving modality switch (vertical dashed line). Shaded area: S.E.M. Color code as in panel c. Right: detection (purple) and discrimination (green) performance distribution for the session before and after the switch (two-sided paired t test comparing days, Det.: ***p = 1.6 × 10–6; Discr.: ***p = 7.2 × 10–5). Performances are also tested against chance level (two-sided t test, Det.: ***p = 2.9 × 10–7 and Blank p = 0.11; Discr.: ***p = 1.2 × 10–5 and Blank p = 0.13). Error bars: S.E.M. i Same as panel g but for TeNT-P2A-GFP expression in the ventral stream (N = 7 mice). j Same as panel h for ventral areas (two-sided paired t test comparing days, Det.: **p = 0.003; Discr.: **p = 0.008). Performances are also tested against chance level (two-sided t test, Det.: ***p = 1.3 × 10–6 and *p = 0.033; Discr.: ***p = 6.7 × 10–6 and *p = 0.027). k Comparison of performance change following rule-preserving switch between all mice expressing TeNT-P2A-GFP and control mice described in Fig. 1e and Supplementary Fig. 1b (N = 22 mice for TeNT and N = 10 mice for control, two-sided unpaired t test, ***p = 2.6 × 10−4). Error bars: S.E.M. l Learning rate estimated over first three sessions following modality switch for mice expressing TeNT-P2A-GFP with impaired cross-modal generalization and control mice trained to the auditory task first described in Fig. 2a (N = 14 mice for TeNT and N = 10 mice for control, two-sided unpaired t test, N.S. p = 0.11). Error bars: S.E.M.
Fig. 7
Fig. 7. Area RL is sufficient for cross-modal generalization.
a Schematic of the behavioral experiment with direct ChR2-mediated optostimulations of RL subregions following modality switch. b Example cranial window of an Ai32 mouse expressing ChR2-eYFP after injection of AAV1.CaMKIIa.Cre viral vectors in area RL. Atlas overlaid for reference. Subregions of RL encoding top or bottom stimuli are indicated in blue or red, respectively. Blue light patterns are shaped to match these subregions (see “Methods”). c Left: Average task performance and conditional lick probabilities across sessions for mice experiencing a rule-preserving modality switch from the whisker task to the optogenetic task (N = 7 mice). Right: detection (purple) and discrimination (green) performance distribution for the session before and after the switch (two-sided paired t test comparing days, Det.: N.S. p = 0.057; Discr.: *p = 0.014). Performances are also tested against chance level (two-sided t test, Det.: ***p = 5.1 × 10–6 and ***p = 7.7 × 10–6; Discr.: ***p = 2.3 × 10–5 and ***p = 2.1 × 10–5). Error bars: S.E.M. d Average detection performance (black) and conditional lick probability for the bottom stimulus (red) or in the absence of stimuli (purple) across sessions for mice switching from the whisker task to the habituation phase to respond to optogenetic stimulations in the bottom-encoding part of RL. e Same as panel c but for mice undergoing a rule-reversing switch (N = 6 mice, two-sided paired t test comparing days, Det.: *p = 0.019; Discr.: ***p = 1.1 × 10−4). Performances are also tested against chance level (two-sided t test, Det.: ***p = 5.6 × 10−5 and *p = 0.019; Discr.: ***p = 7.9 × 10−5 and Blank p = 0.43). f Same as panel d but for mice undergoing habituation to respond to optogenetic stimulations in the top-encoding part of RL. g Left: Comparison of the number of sessions required to reach the detection criterion between mice undergoing a rule-preserving switch and those undergoing a rule-reversing switch (N = 7 mice for rule-preserving and N = 6 mice for rule-reversing, unpaired two-sided t test, *p = 0.032). Right: Comparison of detection performance at the end of the optogenetic habituation phase (unpaired two-sided t test, N.S. p = 0.88). Error bars: S.E.M. h Same as panel b but for optogenetic stimulations of area AL. i Same as panel d but for optogenetic stimulations of AL (N = 7 mice). The detection criterion was never reached during this habituation phase.
Fig. 8
Fig. 8. Neural network architecture for cross-modal generalization.
a Schematic of the neural network model for cross-modal generalization. Synapses projecting to the decision-computing area are the ones undergoing synaptic plasticity during sensorimotor learning. Feedback projections from area AL (dashed lines) are one tenth of the strength of feedback projections from RL (see “Methods”). b Action probability conditional on inputs to S1 before, and inputs to V1 after, a rule-preserving modality switch (vertical dashed line). Red: rewarded bottom stimulations, blue: non-rewarded top stimulations. Green: Discrimination performance. Shaded areas: standard deviation with n = 20 simulations. c Same as panel b after a rule-reversing modality switch. d Same as panel b with silenced RL. e Number of steps necessary to cross a performance threshold of 75% in the full network model (left) or in the model with silenced RL (middle) or silenced AL (right) after rule-preserving or rule-reversing modality switches (n = 20 simulations). Violin plots show the data distribution (the violin outline), while the overlaid box indicates the median (center line), interquartile range (bounds of the box), and 1.5× interquartile range (whiskers). f Left: Number of sessions needed to cross a performance threshold of 65% following the modality switch. Training was stopped after 12 sessions (dashed line) and mice that did not reach the criteria before this session are plotted on the dashed line. Mice numbers are indicated for each group at the bottom of the bar. Error bars: S.E.M. Right: Surprise matrix computed from pairwise unpaired two-sided t test between conditions. A hierarchical clustering based on cosine similarity was used to group conditions based on surprise values.

References

    1. Behrens, T. E. J. et al. What is a cognitive map? organizing knowledge for flexible behavior. Neuron100, 490–509 (2018). - PubMed
    1. Cloke, J. M., Jacklin, D. L. & Winters, B. D. The neural bases of crossmodal object recognition in non-human primates and rodents: A review. Behav. Brain Res.285, 118–130 (2015). - PubMed
    1. Davenport, R. K. & Rogers, C. M. Intermodal equivalence of stimuli in apes. Science (1979)168, 279–280 (1970). - PubMed
    1. Solvi, C., Gutierrez Al-Khudhairy, S. & Chittka, L. Bumble bees display cross-modal object recognition between visual and tactile senses. Science (1979)367, 910–912 (2020). - PubMed
    1. Bruck, J. N. & Pack, A. A. Understanding across the senses: cross-modal studies of cognition in cetaceans. Anim. Cogn.25, 1059–1075 (2022). - PubMed

LinkOut - more resources