. 2025 May 26;16(1):4865.
doi: 10.1038/s41467-025-60141-5.

FOXA2 promotes metastatic competence in small cell lung cancer

Affiliations

FOXA2 promotes metastatic competence in small cell lung cancer

Kenta Kawasaki et al. Nat Commun. .

Abstract

Small cell lung cancer (SCLC) is known for its high metastatic potential, with most patients demonstrating clinically evident metastases in multiple organs at diagnosis. The factors contributing to this exceptional metastatic capacity have not been defined. To bridge this gap, we compare gene expression in SCLC patient samples who never experienced metastasis or relapse throughout their clinical course, versus primary SCLC patient samples from more typical patients who had metastatic disease at diagnosis. This analysis identifies FOXA2 as a transcription factor strongly associated with SCLC metastasis. Subsequent analyses in experimental models demonstrates that FOXA2 induces a fetal neuroendocrine gene expression program and promotes multi-site metastasis. Moreover, we identify ASCL1, a transcription factor known for its initiating role in SCLC tumorigenesis, as a direct binder of the FOXA2 promoter and regulator of FOXA2 expression. Taken together, these data define the ASCL1-FOXA2 axis as a critical driver of multiorgan SCLC metastasis.


Conflict of interest statement

Competing interests: A.Q.V. has received honoraria from and is currently fully employed by Astra Zeneca. J.M. holds company stock from Scholar Rock. C.M.R. has consulted regarding oncology drug development with AbbVie, Amgen, Astra Zeneca, Boehringer Ingelheim, Daiichi Sankyo, Genentech/Roche, Jazz, and Merck, and serves on the scientific advisory boards of Auron, Bridge Medicines, DISCO, Earli, and Harpoon Therapeutics. C.M.R. has received licensing fees and royalties based on DLL3 antibody-based therapeutics. The remaining authors declare no competing interests.

Figures

Fig. 1
Fig. 1. Metastatic characteristics of SCLC.
a Metastatic characteristics of an MSK-SCLC cohort (N = 327). Localized disease (left) including the fraction of never-metastasized cases (dark blue). Frequency (middle) and number (right) of distant metastatic sites are shown among cases with any metastases. LN: Lymph node. b Schematic of the approach to metastatic subline generation in SCLC cell lines. i.c.: intra-cardiac injection. Created in BioRender. Rudin C. (2025) https://BioRender.com/j5rkxx5. c Frequency and distribution of metastases in H1836 (ASCL1 subtype) and H82 (NEUROD1 subtype) SCLC cell lines, and Lx773I SCLC PDX (POU2F3 subtype) parental lines and organ-specific sublines after intracardiac implantation.
Fig. 2
Fig. 2. Genetic and expression profiles of the SCLC cohort.
a Sample selection schema of never-metastatic (left) and metastatic SCLC. Created in BioRender. Rudin C. (2025) https://BioRender.com/qkiri1o. b Prevalent mutations in never-metastasized primary SCLC and metastatic SCLC cohort. c Heatmap of never-met primary SCLC, metastasis-associated (met-associated) primary SCLC, and metastatic SCLC. d Heatmap of never-met primary SCLC and met-associated primary SCLC. e Heatmap of never-met primary SCLC and metastatic SCLC. f Overlapping factors from panel (d, e). The data are analyzed with Wald’s test and 8 transcription factors were nominated following the criteria of FC > 4 or FC < −4, Padj < 0.05. The number of transcription factors is indicated in brackets. g Violin plot of expression for each of the 8 candidates based on scRNA-seq data of primary SCLC. h Volcano plot of candidate genes in bulk RNA-seq data comparing the expression of met-associated primary SCLC to never-met primary SCLC. i UMAP of FOXA2 in each component from scRNA-seq. j FOXA2 expression in primary SCLC with or without lymph node (LN) metastasis from the data of Liu Q et al. Graph is shown as mean ± SEM (* < 0.05, P = 0.04, two-sided Student’s t-test).
Fig. 3
Fig. 3. FOXA2 promotes SCLC metastasis.
a Clinical validation using the TMA tissue sections. FOXA2 H-score of a TMA of limited stage SCLC patients comparing those with no relapse (N = 11) vs. relapse (N = 15) (* < 0.05, P = 0.049, two-sided Student’s t-test). b Relapse-free survival of patients with FOXA2low and FOXA2high tumors (** < 0.01, P = 0.0033, log-rank test). cf FOXA2 KD with short-harpin RNA (sh) in cell lines H1836 (c, d) and SHP-77 (e, f) and metastatic burden assessment. Total photon reflux [p/s] is indicated in graphs (c, e), and the number of macroscopic metastases after euthanasia are indicated in graphs (d, f). Mean ± SEM (* < 0.05, ** <0.01, *** <0.001, **** <0.0001, one-way ANOVA. c; P = 6.0 ×  10-4(top), P = 7.0 × 10-4(bottom), d P = 4.6 × 10-4(left), P = 1.0 × 10-3(right), e P = 0.033(top), P = 2.6 × 10-4(bottom), f P = 0.014(left), P = 9.6 × 10-3(right)). g, h Mouse Foxa2 overexpression (OE) in KD cell line SHP-77. Total photon reflux [p/s] is indicated in graph (g) and the number of microscopic liver metastases in each liver lobe after euthanasia are indicated in graph (h). Mean ± SEM (** < 0.01, g; P = 2.3 × 10-3, h; P = 3.6 × 10-3, two-sided Student’s t-test). i FOXA2 immunohistochemistry (IHC) of H1963 subcutaneous tumor and its ovarian metastasis generated by intra-cardiac injection. Scale bar: 500 μm and 100 μm (inset). j, k Schematic of the generation of ovarian metastasis (Ovamet) subline (j) and FOXA2 western blot of parental and ovarian metastasis subline (k). Western blot result is a representative data of one of the 3 individual experiments. Created in BioRender. Rudin C. (2025) https://BioRender.com/58ppd5o.
Fig. 4
Fig. 4. FOXA2 effects on proliferation and gene expression.
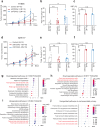
af Subcutaneous tumor growth of FOXA2 KD and control cell lines (H1836, SHP-77). Tumor proliferation and growth as measured by tumor volume (a, d), BLI (b, e), and Ki67 score (c, f). Graphs indicate mean±S.D. (*** < 0.001, one-way ANOVA. a P = 4.2 × 10-4, b P = 0.012). gi Pathway analysis of RNA-seq data on FOXA2 KD or OE cell lines compared to FOXA2 wild control. This GSEA analysis was based on the 3 replicates submitted for RNA-seq for each cell line. Top pathways downregulated in FOXA2 KD cell lines (H1836 (g), SHP-77 (h)) and upregulated in the FOXA2 OE cell line (H1963 (i)) are indicated.”Set size” refers to the total number of genes in the pathway and the exact number and genes can be traced in the supplementary data. j Upregulated pathways in met-associated primary tumor compared to never-met primary tumor. This analysis is generated from 1 RNA-seq data set (the same set from Fig. 2) of clinical samples using GSEA pathway analysis. N.s. Not significant, NES normalized enrichment score.
Fig. 5
Fig. 5. Gene associations and regulation of FOXA2 expression.
a FOXA2 IHC staining of primary SCLC. Representative images of a FOXA2-negative region and a FOXA2-positive region are shown. Scale bar: 500 μm and 100 μm (inset). b scRNA-seq UMAP including 19 clinical metastatic SCLC tumors indicating FOXA2+ and FOXA2- cells. c Violin plot of FOXA2 expression by scRNA-seq in each of these 19 cases. d Pulmonary neuroendocrine cell signature expression in FOXA2+ cells and FOXA2- cells assessed by scRNA-seq (** < 0.01, P = 0.0000, one-sided Mann–Whitney U test). e Ranking plot of genes highly expressed in FOXA2+ vs. FOXA2- cells at the single-cell level. f Correlation plot of nominated top 100 genes from panel (e) assessed relative to FOXA2 expression in bulk RNA-seq data. g Heatmap of co-expression on ASCL1, FOXA2, and PROX1 in scRNA-seq. h ASCL1 KD effect on protein expression of PROX1, FOXA2, and GAPDH (control) in H1836 and SHP-77 cell lines. The samples derive from the same experiment but different gels for ASCL1, FOXA2, another for PROX1 and GAPDH were processed in parallel. Western blot result is a representative data of one of the 3 individual experiments. i, j ASCL1 ChIP-seq at the FOXA2 and PROX1 gene loci in 2 SCLC cell lines (H1836 and SHP-77). Two independent replicates using anti-ASCL1, and two isotype (IgG) controls are shown. Highlighted regions indicate promoter and enhancer domains. k PROX1 KD and protein expression of FOXA2 and GAPDH (control) in H1836 and SHP-77 cell lines. The samples derive from the same experiment but different gels for FOXA2, another for PROX1 and GAPDH were processed in parallel. Western blot result is a representative data of one of the 3 individual experiments.
Fig. 6
Fig. 6. ASCL1 binds to the FOXA2 locus in met-associated primary SCLC.
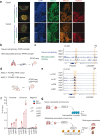
a Immunofluorescence (IF) image of never-met primary and met-associated primary tumor clinical samples stained for DAPI, ASCL1, PROX1, and FOXA2 for 2 cases. Insets are indicated in white box. Scale bar: 1000 μm (overlay), 100 μm (DAPI, ASCL1, FOXA2). b Schematic of FFPE-ATAC-seq from never-met primary and met-associated primary tumor clinical samples. Created in BioRender. Rudin C. (2025) https://BioRender.com/mlreujw. c Chromatin accessibility assessed by ATAC-seq at the FOXA2 locus (Peaknorm). Highlighted regions indicate promoter and enhancer domains. d Schematic of ATAC-seq and ChIP-qPCR on PDX tumors. Created in BioRender. Rudin C. (2025) https://BioRender.com/mlreujw. e ATAC-seq comparing ASCL1+FOXA2+ PDX (Lx101, Lx328, Lx891) vs ASCL1+FOXA2- (Lx1231) PDX tumors at the FOXA2 locus. f IgG and ASCL1 ChIP-qPCR of the FOXA2 locus, and negative control region in one ASCL1+FOXA2- (A + F-) and three ASCL1+FOXA2+ (A + F + ) SCLC PDX models from panel. Bars are shown in Mean±S.D of N = 3 experimental replicates. g Schematic of ASCL1 interaction with FOXA2 in never-met versus met-associated SCLC. Created in BioRender. Rudin C. (2025) https://BioRender.com/j34m841.

References

    1. Rudin, C. M., Brambilla, E., Faivre-Finn, C. & Sage, J. Small-cell lung cancer. Nat. Rev. Dis. Prim.7, 3 (2021). - PMC - PubMed
    1. Kawasaki, K., Rekhtman, N., Quintanal-Villalonga, Á. & Rudin, C. M. Neuroendocrine neoplasms of the lung and gastrointestinal system: convergent biology and a path to better therapies. Nat. Rev. Clin. Oncol.20, 16–32 (2023). - PubMed
    1. Chen, H.-Z. et al. Genomic and transcriptomic characterization of relapsed sclc through rapid research autopsy. JTO Clin. Res. Rep.2, 100164 (2021). - PMC - PubMed
    1. Ciampricotti, M. et al. Rlf-Mycl gene fusion drives tumorigenesis and metastasis in a mouse model of small cell. Lung Cancer Cancer Discov.11, 3214–3229 (2021). - PMC - PubMed
    1. Kwon, M. et al. Paracrine signaling between tumor subclones of mouse SCLC: a critical role of ETS transcription factor Pea3 in facilitating metastasis. Genes Dev.29, 1587–1592 (2015). - PMC - PubMed

MeSH terms

Substances