. 2025 May 27;16(1):4884.
doi: 10.1038/s41467-025-59404-y.

Spike-in enhanced phosphoproteomics uncovers synergistic signaling responses to MEK inhibition in colon cancer cells

Affiliations

Spike-in enhanced phosphoproteomics uncovers synergistic signaling responses to MEK inhibition in colon cancer cells

Mirjam van Bentum et al. Nat Commun. .

Abstract

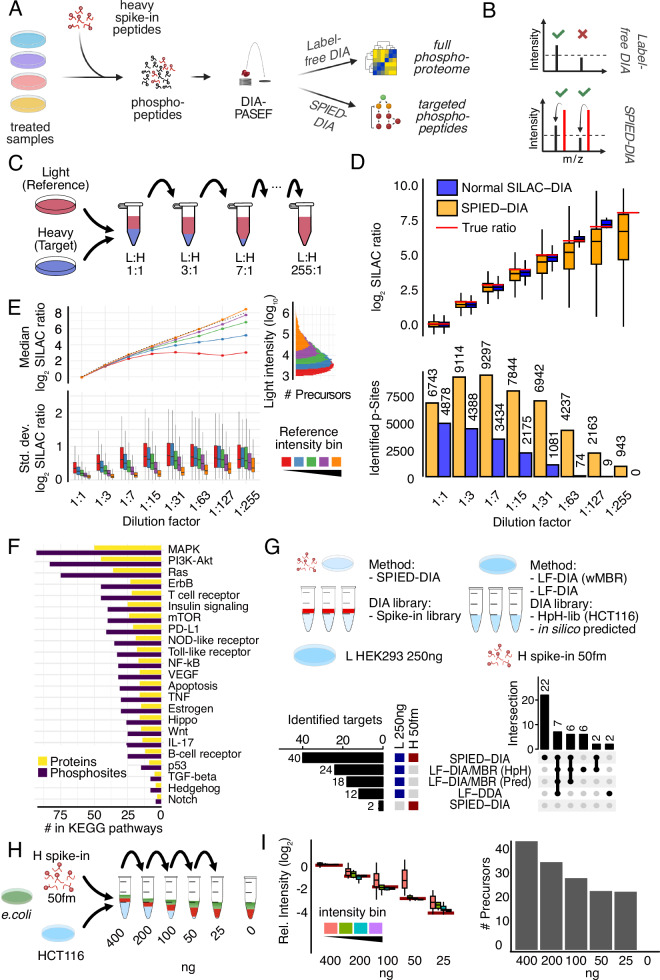
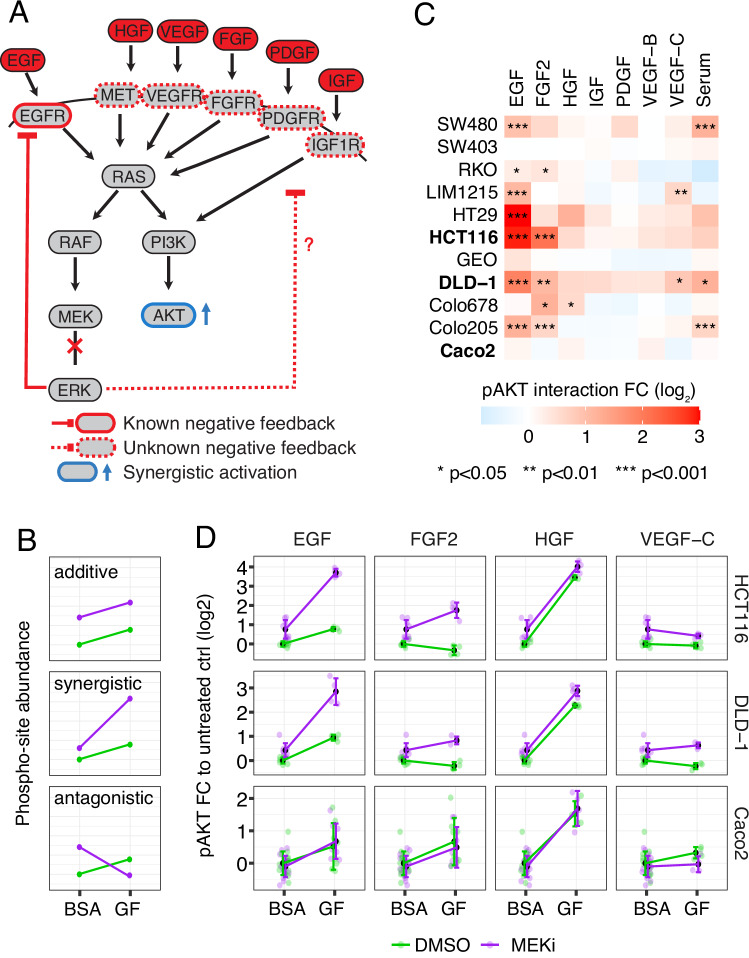
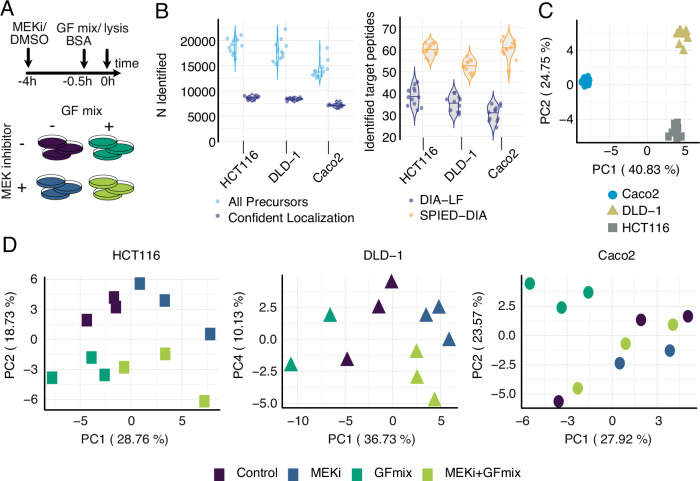
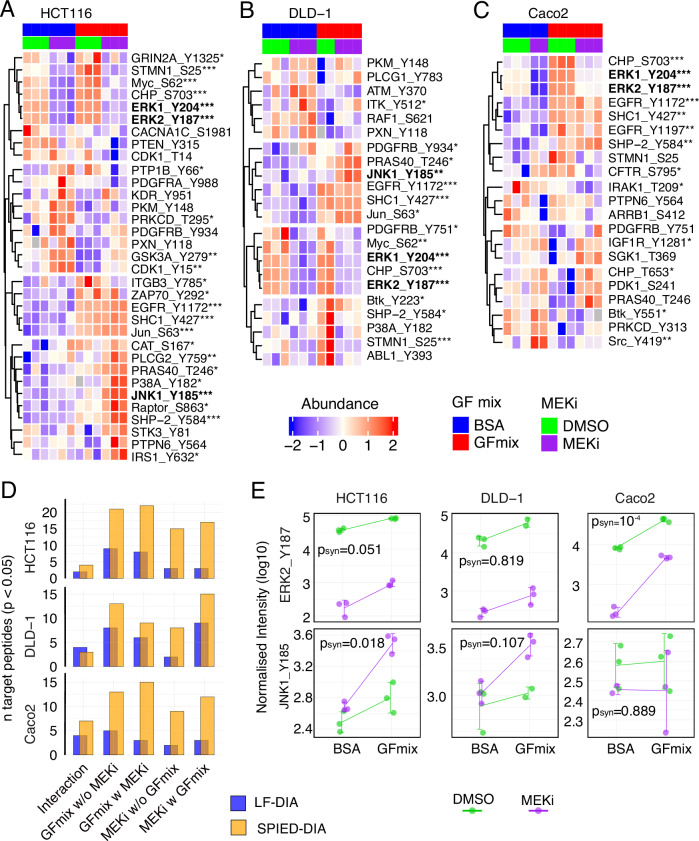
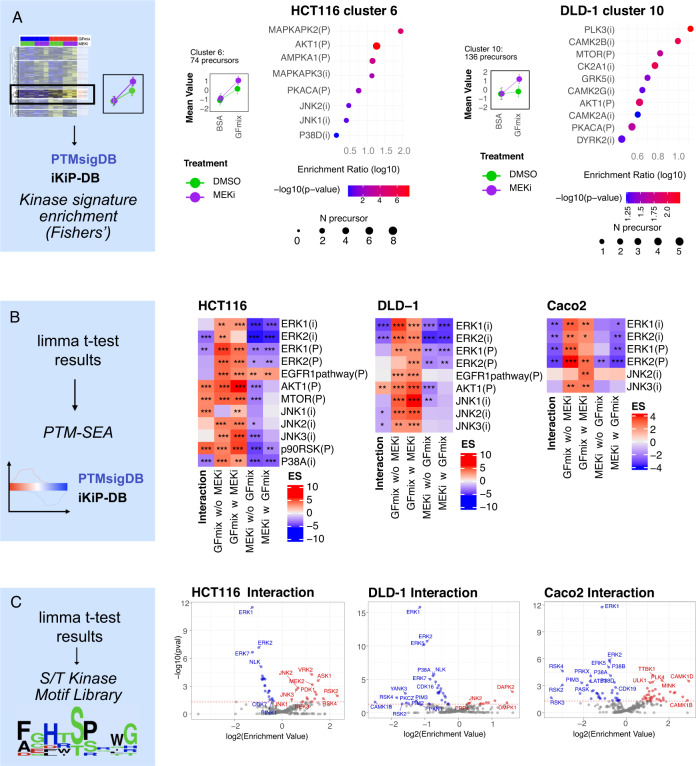
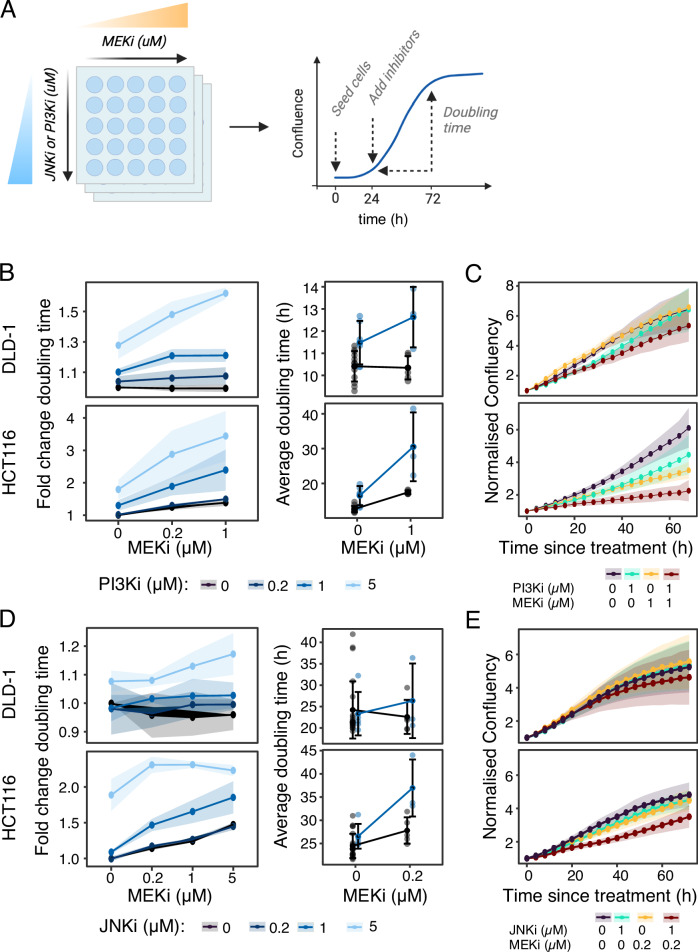
Targeted kinase inhibitors are a cornerstone of cancer therapy, but their success is often hindered by the complexity of cellular signaling networks that can lead to resistance. Overcoming this challenge necessitates a deep understanding of cellular signaling responses. While standard global phosphoproteomics offers extensive insights, lengthy processing times, the complexity of data interpretation, and frequent omission of crucial phosphorylation sites limit its utility. Here, we combine data-independent acquisition (DIA) with spike-in of synthetic heavy stable isotope-labeled phosphopeptides to facilitate the targeted detection of particularly informative phosphorylation sites. Our spike-in enhanced detection in DIA (SPIED-DIA) approach integrates the improved sensitivity of spike-in-based targeted detection with the discovery potential of global phosphoproteomics into a simple workflow. We employed this method to investigate synergistic signaling responses in colorectal cancer cell lines following MEK inhibition. Our findings highlight that combining MEK inhibition with growth factor stimulation synergistically activates JNK signaling in HCT116 cells. This synergy emphasizes the therapeutic potential of concurrently targeting MEK and JNK pathways, as evidenced by the significantly impaired growth of HCT116 cells when treated with both inhibitors. Our results demonstrate that SPIED-DIA effectively identifies synergistic signaling responses in colorectal cancer cells, presenting a valuable tool for uncovering new therapeutic targets and strategies in cancer treatment.


Conflict of interest statement

Competing interests: The authors declare no competing interests.

Figures

Fig. 1
Fig. 1. Design and benchmarking of Spike-In Enhanced Detection in Data-Independent Acquisition (SPIED-DIA).
Spike-in enhanced detection in data independent acquisition (SPIED-DIA) (on previous page) (A) Workflow depicting the integration of Label-free (LF) DIA with SPIED-DIA. B Quantification and identification in LF-DIA and SPIED-DIA. C Schematic of the dilution series used to benchmark the performance of SPIED-DIA. D Number of phospho-sequences identified in at least 2 out of 3 technical replicates and corresponding H/L channel intensities. E SILAC ratio variability by light intensity and dilution derived from all quantified precursors in three technical replicates. Lines show median log2 SILAC ratios across dilution factors, binned by reference channel (L) intensity with equally sized bins. Expected ratios are shown as a dotted line. Histogram depicts precursor count distribution by log10 light intensity. Boxplots show standard deviation of log2 SILAC ratios by dilution and bin, aggregated at the modified sequence level. F Signaling pathway origins of phosphosites selected for spike-in peptide library. G Improved target peptide identification with SPIED-DIA. Targets identified in 2 out of 3 biological replicates, with a CV lower than 10%. Upset plot depicts intersections > 1. wMBR: with match-between-runs, HpH-lib: library created by high pH fractionation phosphoproteomics. H Dilution series of heavy peptides in light samples in 100 ng E. coli background, 3 replicates. I Relative mean intensity (n = 3) of precursors normalised to 400 ng L condition, filtered as in panel G Red lines depict expected relative intensity. All Boxplots show the median, interquartile range, whiskers at max 1.5×IQR, and exclude outliers. Source data are provided as a Source Data file.
Fig. 2
Fig. 2. Overview analysis CRC cell-line panel treated with MEKi and growth factor mix.
A Conceptual illustration of synergistic activation of AKT upon MEKi through receptor feedback loops and B Schematic explanation of interaction types. Where possible, color coding was consistent throughout the manuscript. C Heatmap summarizing screening results for pAKT synergistic activation across CRC cell lines upon 3.66 h MEK inhibition (1 µM Selumetinib) and subsequent 20 min stimulation with the indicated growth factors/serum, n ≥ 4, two-way anova. D Quantitative Luminex measurement of pAKT response to growth factors in CRC cell lines, data are shown as mean + standard deviation, n ≥ 4. Source data are provided as a Source Data file.
Fig. 3
Fig. 3. Overview analysis CRC cell-line panel treated with MEKi and growth factor mix.
A Experimental design of CRC panel treated with MEKi (10 µM Selumetinib) and growth factor mix (GFmix, EGF, HGF, FGF2, and VEGF-C). B Number of identified phosphopeptides per sample. Separated according to all precursors and precursors with confidently localised phosphosites (left panel) and a comparison of identified target peptides between the label-free quantification pipeline and SPIED (right panel). C Principal Component Analysis (PCA) of CRC cell lines, based on precursors identified in all samples in the label free results (n = 1699). D PCA for HCT116, DLD-1, Caco2 based on precursors identified in all runs per cell line in label-free analysis: 3423, 3476, and 3185 phosphopeptides, respectively. Each point represents a sample. Variance explained by principal components is indicated. Source data are provided as a Source Data file.
Fig. 4
Fig. 4. SPIED-DIA analysis of targeted regulated phosphorylation sites.
Heatmaps display significant phosphosite regulation across different conditions in HCT116 (A), DLD-1 (B), and Caco2 (C) cells. All depicted phosphosites passed limma moderated F-test (two-sided) p-value cut-off of 0.1. F-test p-values for specific sites are indicated by asterisks (*, p < 0.05; **, p < 0.01; ***, p < 0.001). Color scale represents row-wise Z-normalized abundance. D Significantly regulated target phosphosites identified through limma moderated t-test (two-sided) p-value < 0.05. E Log10 transformed loess-normalised precursor-level intensities of selected phosphorylation sites. Error bars indicate standard deviation and mean and p-values derived from synergistic effect test with limma moderated t-test (two-sided). Three biological replicates unless otherwise indicated. Source data are provided as a Source Data file.
Fig. 5
Fig. 5. Analysis of label-free quantification data and kinase activity profiling.
A Kinase signature enrichment analysis of synergistic profile clusters from hierarchical clustered label-free data. Z-scored intensity profiles of treatment conditions within clusters. Data represented as mean ± standard deviation. Kinase signatures selected from PhosphoSitePlus and iKiP-DB. Size and color of points indicate number of precursors and significance (Fishers’ exact test), respectively. Biological replicates as indicated in Fig. 4. B Selected results from PTM-SEA using PhosphoSitePlus (PSP) and iKiP-DB kinase signatures, denoted by (P) and (i), respectively. PTM-SEA input consists of fold change signed p-values from limma moderated t-test (two-sided), filtered for phosphopeptides with moderated F-test (two-sided) p-value < 0.1, indicating significant regulation in at least one test. ES = enrichment score as calculated by PTM-SEA. Significance is denoted by asterisks, with * p < 0.1, ** p < 0.05, *** p < 0.01. C Kinase Library S/T (Serine/Threonine) Kinase Motif Enrichment Analysis. To derive ‘foreground’ phosphosites, moderated t-test results were filtered for a fold change (FC) > 0.1 and a p-value < 0.05. The output is the enrichment value (EV). Results for interaction test are depicted. Source data are provided as a Source Data file.
Fig. 6
Fig. 6. Experimental workflow and results for combination treatment with MEKi and JNKi or PI3Ki.
A Experimental workflow depicting inhibitor treatment of cell lines prior to measurement of cell growth and doubling time with live-cell imaging. B Cell doubling time fold changes relative to within replicate controls, 48 h post-treatment with inhibitors. Insets depict doubling times at selected concentrations. C Growth curves of cells within selected treatment conditions, normalized to treatment-start. D, E Similar to panels B, C, these graphs display the effects of combining MEKi with JNKi on cell doubling time and growth curves. Data are presented as mean + standard deviation, shaded ribbons also indicate standard deviation. n ≥ 3. Source data are provided as a Source Data file.

Similar articles

Cited by

References

    1. Hanahan, D. Hallmarks of cancer: new dimensions. Cancer Discov.12, 31–46 (2022). - PubMed
    1. Cohen, P., Cross, D. & Jänne, P. A. Kinase drug discovery 20 years after imatinib: progress and future directions. Nat. Rev. Drug Discov.20, 551–569 (2021). - PMC - PubMed
    1. Xie, Y.-H., Chen, Y.-X. & Fang, J.-Y. Comprehensive review of targeted therapy for colorectal cancer. Signal Transduct. Target. Ther.5, 22 (2020). - PMC - PubMed
    1. Britschgi, A. et al. JAK2/STAT5 inhibition circumvents resistance to PI3K/mTOR blockade: a rationale for cotargeting these pathways in metastatic breast cancer. Cancer Cell22, 796–811 (2012). - PubMed
    1. Dorel, M. et al. Neuroblastoma signalling models unveil combination therapies targeting feedback-mediated resistance. PLoS Comput. Biol.17, e1009515 (2021). - PMC - PubMed

MeSH terms

Substances

LinkOut - more resources