

Integrating machine learning and multi-omics analysis to unveil key programmed cell death patterns and immunotherapy targets in kidney renal clear cell carcinoma
- PMID: 40419510
- PMCID: PMC12106685
- DOI: 10.1038/s41598-025-00759-z
Integrating machine learning and multi-omics analysis to unveil key programmed cell death patterns and immunotherapy targets in kidney renal clear cell carcinoma
Abstract
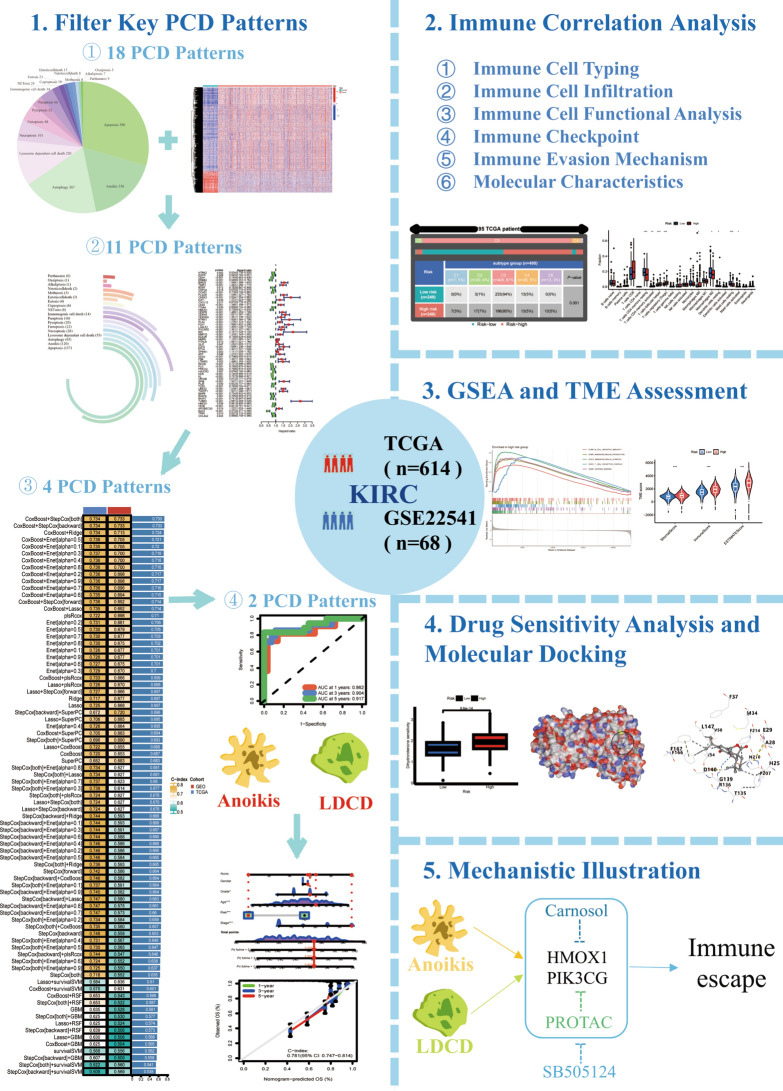
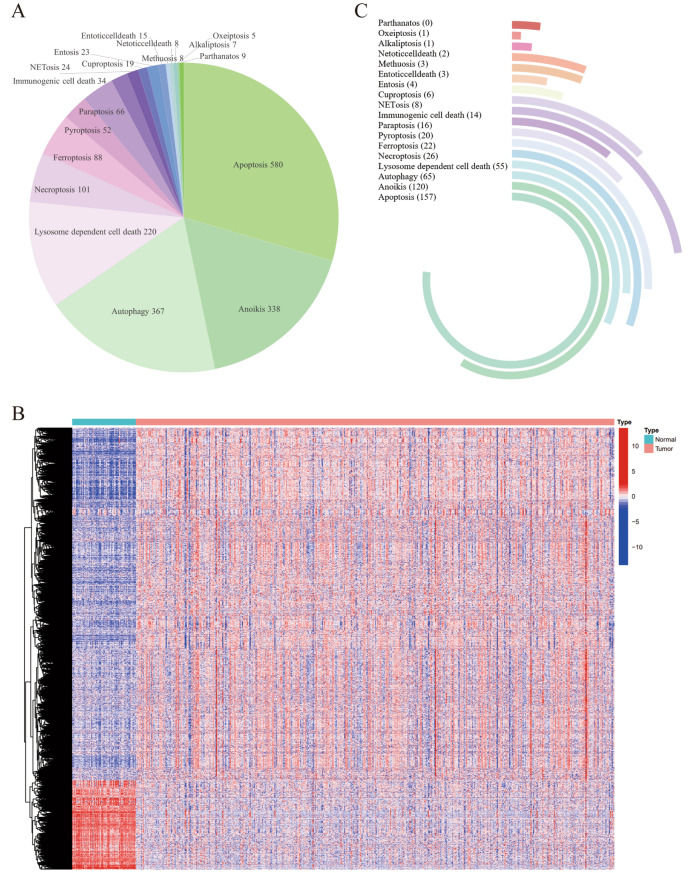
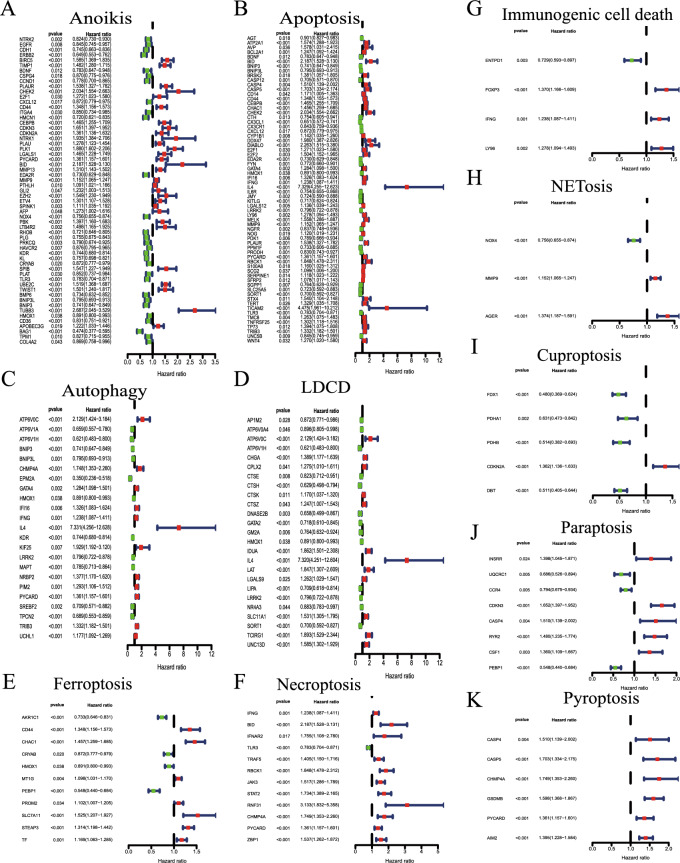
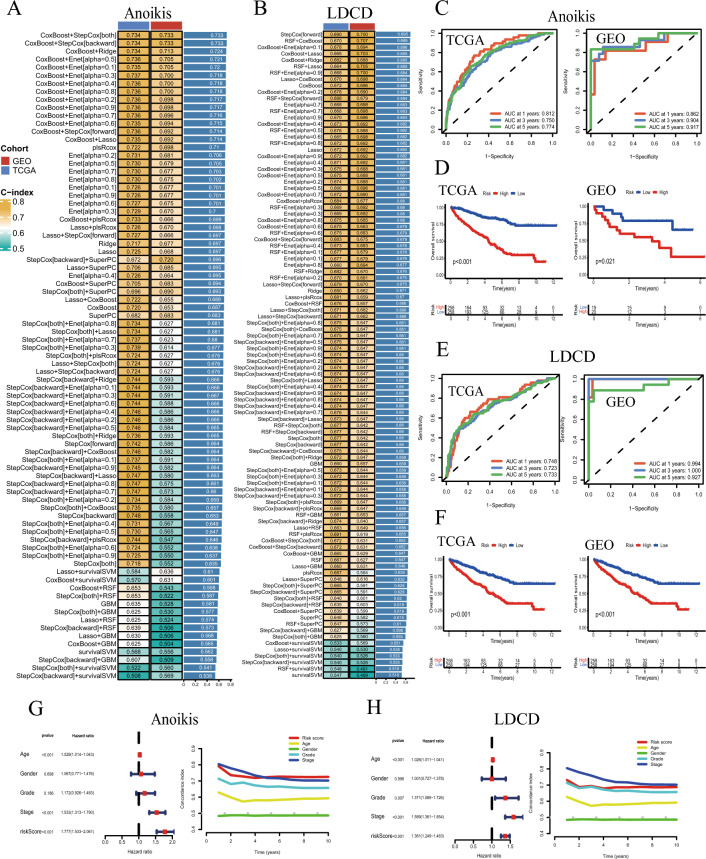
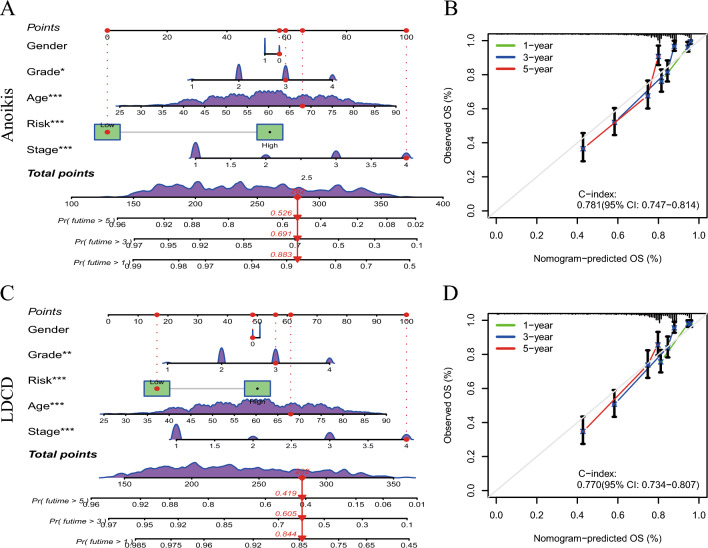
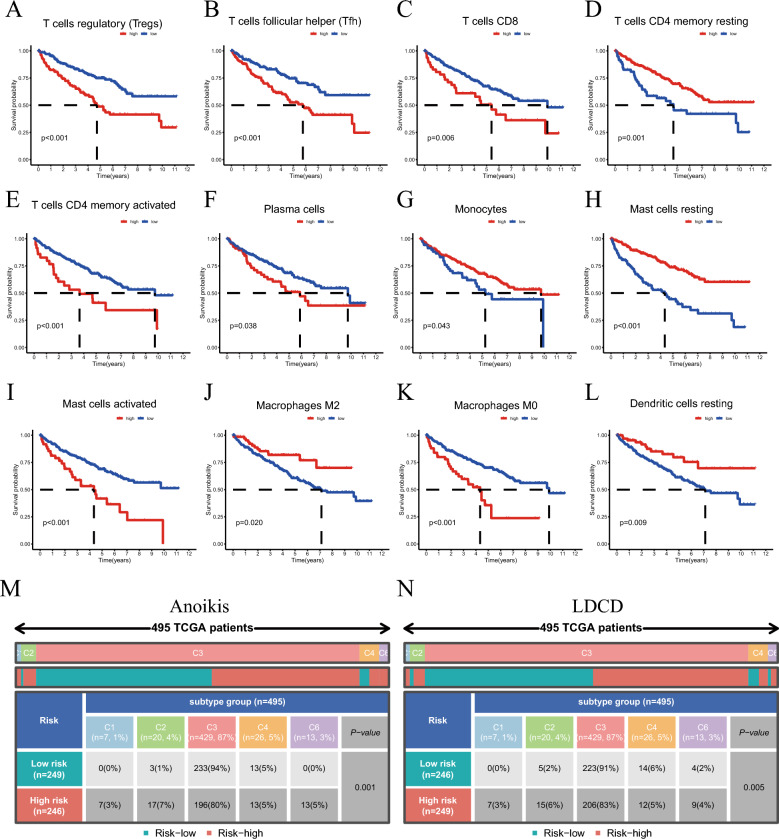
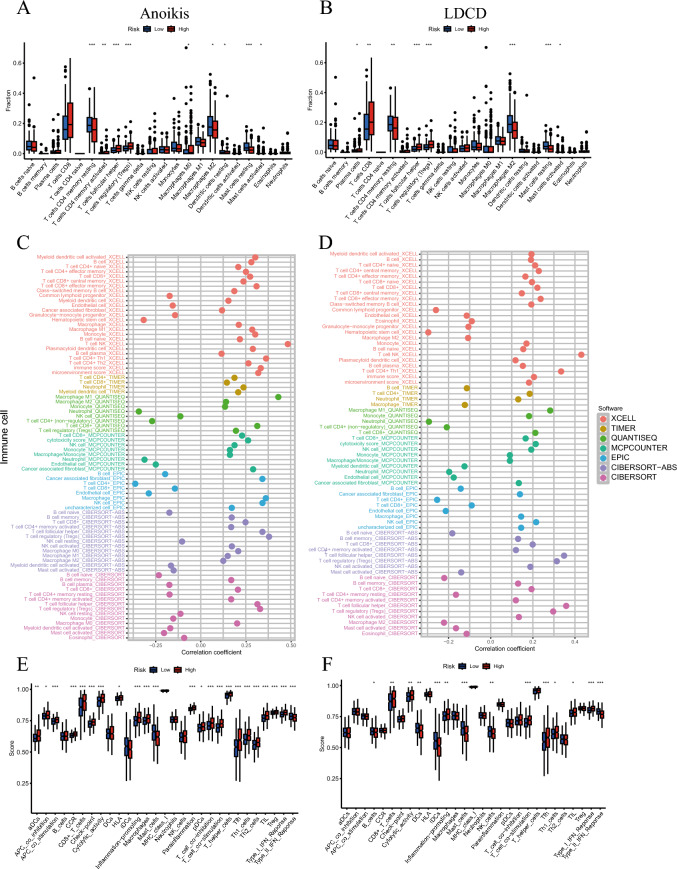
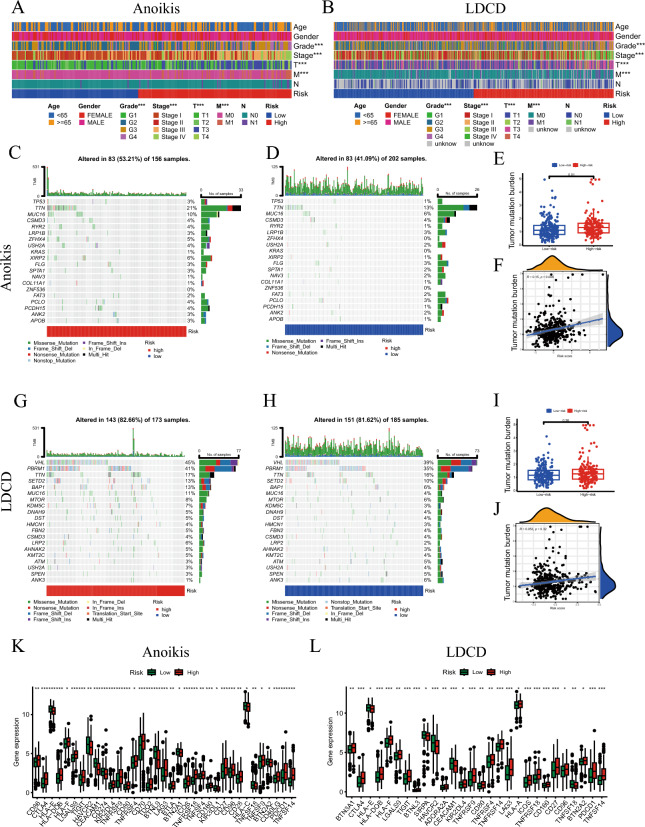
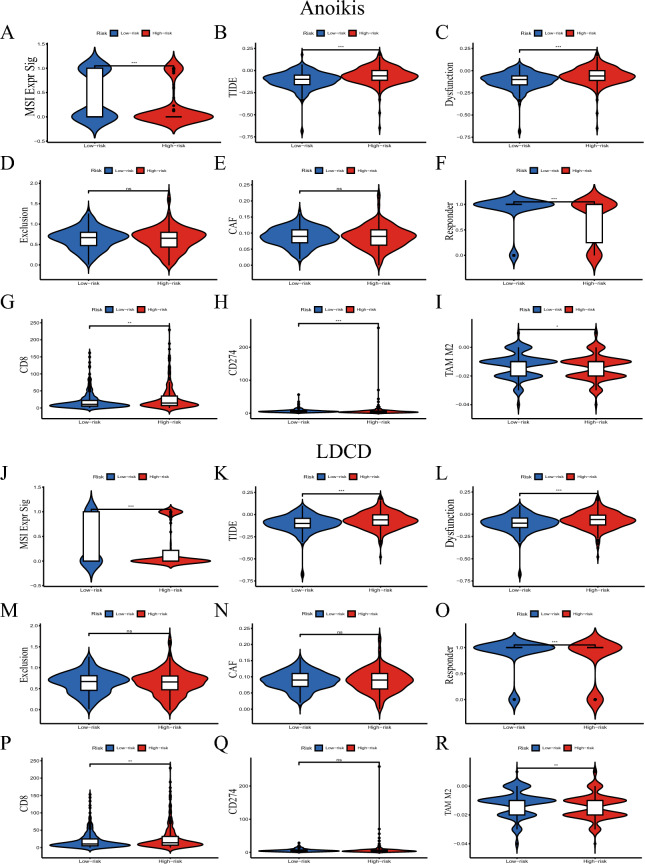
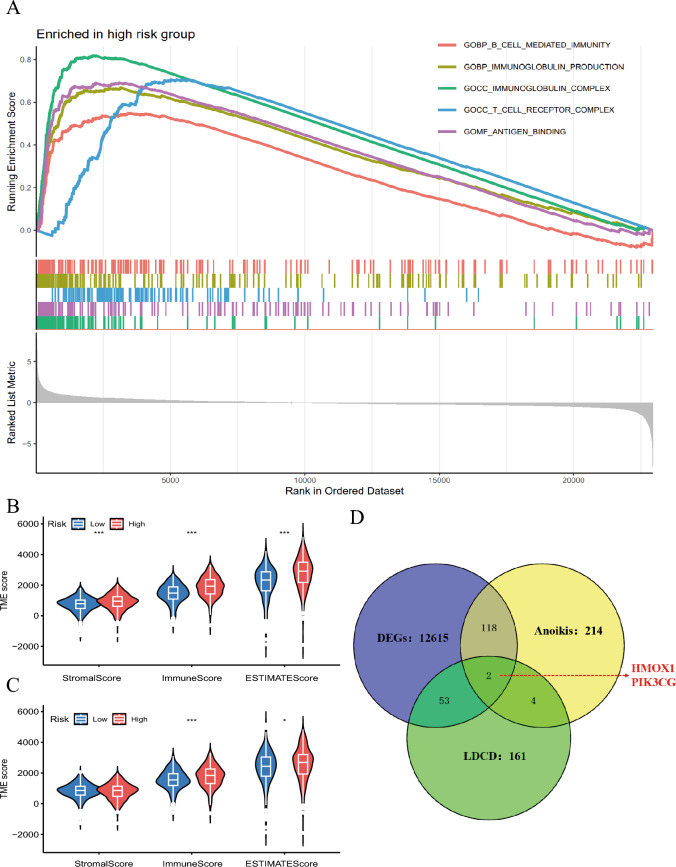
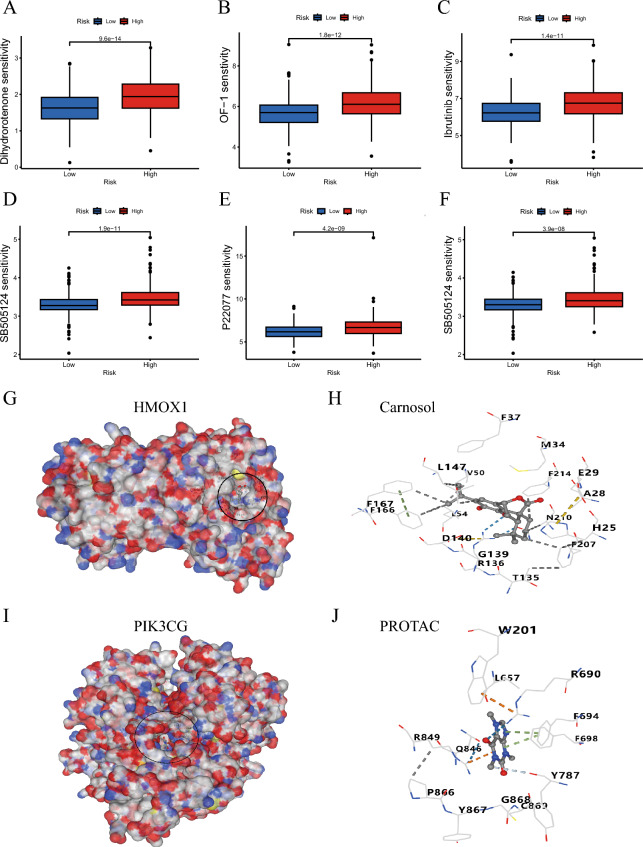
Kidney renal clear cell carcinoma (KIRC), a cancer characterized by substantial immune infiltration, exhibits limited sensitivity to conventional radiochemotherapy. Although immunotherapy has shown efficacy in some patients, its applicability is not universally effective. Studies have indicated that programmed cell death (PCD) can modulate the activity of immune cells and participate in the regulation of antitumor immune responses. However, systematic research on how various PCD patterns in KIRC affect the responsiveness to immunotherapy is lacking and requires in-depth investigation. We utilized a combination of 101 machine learning algorithms to analyze the TCGA-KIRC cohort and the GSE22541 KIRC patients, screening for cell death patterns closely associated with prognosis from 18 potential modes. Integrating multi-omics analysis, including immune cell infiltration, phenotyping, functional analysis, immune checkpoint exploration, and gene set enrichment analysis (GSEA), we explored the relationship between key cell death patterns and patients' responses to immunotherapy. Finally, potential drug targets were identified through drug sensitivity screening and molecular docking techniques. Our sophisticated risk assessment model successfully identified two PCD patterns, Anoikis and lysosome-dependent cell death (LDCD), closely associated with the prognosis of KIRC patients, with the high-risk group exhibiting poor outcomes. Immune cell analysis revealed upregulated expression of T follicular helper (Tfh) cells in both PCD patterns. Analysis of immune checkpoints disclosed enhanced expression of human leukocyte antigen E (HLA-E) across both patterns. Frequent mutations in the TTN and MUC16 genes were observed in the Anoikis pattern, whereas in the LDCD pattern, although the high-risk group had a higher mutation rate, there was no significant difference in tumor mutational burden. GSEA analysis indicated significant enrichment of the primary immunodeficiency pathway in the Anoikis high-risk group and significant enrichment of the spliceosomal tri-snrnp complex assembly pathway in the LDCD high-risk group. Drug sensitivity analysis showed notable sensitivity to SB505124 in both PCD patterns. HMOX1 and PIK3CG were identified as common genes in the two key PCD patterns, and molecular docking analysis confirmed stable binding affinity between Carnosol and HMOX1, and between PROTAC and PIK3CG. Our study identifies Anoikis and LDCD as prognostic PCD patterns in KIRC, with key immune cells, genetic mutations, and drug sensitivity profiles. HMOX1 and PIK3CG are common genes with stable binding to Carnosol and PROTAC, respectively, while SB505124 shows significant sensitivity to both PCD modes, suggesting potential therapeutic targets.
Keywords: Immune checkpoints; KIRC; Machine learning algorithms; Programmed cell death.
© 2025. The Author(s).
Conflict of interest statement
Competing interests: The authors declare no competing interests.
Figures
Similar articles
-
Integrated machine learning survival framework develops a prognostic model based on macrophage-related genes and programmed cell death signatures in a multi-sample Kidney renal clear cell carcinoma.Cell Biol Toxicol. 2025 May 30;41(1):93. doi: 10.1007/s10565-025-10023-9. Cell Biol Toxicol. 2025. PMID: 40447904 Free PMC article.
-
Identification of immune characteristics between different subtypes in kidney renal clear cell carcinoma based on lysosome-related genes to assist immunotherapy.Hum Immunol. 2025 Jan;86(1):111223. doi: 10.1016/j.humimm.2024.111223. Epub 2025 Jan 3. Hum Immunol. 2025. PMID: 39755002
-
Anoikis resistance regulates immune infiltration and drug sensitivity in clear-cell renal cell carcinoma: insights from multi omics, single cell analysis and in vitro experiment.Front Immunol. 2024 Jun 17;15:1427475. doi: 10.3389/fimmu.2024.1427475. eCollection 2024. Front Immunol. 2024. PMID: 38953023 Free PMC article.
-
ZEB family is a prognostic biomarker and correlates with anoikis and immune infiltration in kidney renal clear cell carcinoma.BMC Med Genomics. 2024 Jun 5;17(1):153. doi: 10.1186/s12920-024-01895-7. BMC Med Genomics. 2024. PMID: 38840097 Free PMC article.
-
Harnessing programmed cell death as a therapeutic strategy in rheumatic diseases.Nat Rev Rheumatol. 2011 Mar;7(3):152-60. doi: 10.1038/nrrheum.2010.225. Epub 2011 Feb 1. Nat Rev Rheumatol. 2011. PMID: 21283145 Free PMC article. Review.
References
-
- Sung, H. et al. Global cancer statistics 2020: GLOBOCAN estimates of incidence and mortality worldwide for 36 cancers in 185 countries. CA Cancer J. Clin.71(3), 209–249 (2021). - PubMed
-
- Pontes, O. et al. Renal cell carcinoma therapy: current and new drug candidates. Drug Discov. Today27(1), 304–314 (2022). - PubMed
-
- Wang, Y. Z. & Hu, Y. Age-period-cohort analysis on kidney cancer mortality trend in China, 1992–2016. Zhonghua Liu Xing Bing Xue Za Zhi42(3), 508–512 (2021). - PubMed
-
- Ji, Y. T. et al. Comparison of the latest cancer statistics, cancer epidemic trends and determinants between China and the United States. Zhonghua Zhong Liu Za Zhi46(7), 646–656 (2024). - PubMed
-
- Moch, H. et al. The 2022 world health organization classification of tumours of the urinary system and male genital organs-part a: renal, penile, and testicular tumours. Eur. Urol.82(5), 458–468 (2022). - PubMed
MeSH terms
LinkOut - more resources
Full Text Sources
Medical
Research Materials
Miscellaneous
