. 2025 May 26;16(1):4877.
doi: 10.1038/s41467-025-60015-w.

Provoking tumor disulfidptosis by single-atom nanozyme via regulating cellular energy supply and reducing power

Affiliations

Provoking tumor disulfidptosis by single-atom nanozyme via regulating cellular energy supply and reducing power

Wenxin Yu et al. Nat Commun. .

Abstract

Disulfidptosis, a recently identified form of programmed cell death, is initiated by depletion of endogenous nicotinamide adenine dinucleotide phosphate (NADPH) under glucose starvation. Tumor cells, owing to their heightened requirements of energy and nutrients, are more susceptible to disulfidptosis than normal cells. Here, we introduced an effective strategy to induce tumor disulfidptosis via interrupting cellular energy supply and reducing power by integrating a copper single-atom nanozyme (CuSAE) and glucose oxidase (GOx). GOx induces glucose starvation, impeding generation of NADPH through pentose phosphate pathway (PPP). CuSAE mimics NADPH oxidase, depleting existing NADPH, which intensifies the blockade of disulfide reduction and efficiently triggers disulfidptosis of tumor cells. Furthermore, CuSAE exhibits peroxidase- and glutathione oxidase-mimicking activities, catalyzing generation of •OH radical and depletion cellular GSH, which enhances oxidative stress and exacerbates cell damage. Disulfidptosis is confirmed as the predominant type of cell death induced by GOx/CuSAE. In vivo assays demonstrated the high antitumor potency of GOx/CuSAE in treating with female tumor-bearing mice, with minimal systemic toxicity observed. This work introduces a promising strategy for designing antitumor agents by inducing disulfidptosis. The enzyme hybrids that combine nanozymes and natural enzymes offer a feasible approach to achieve this multifaceted therapeutic goal.


Conflict of interest statement

Competing interests: The authors declare no competing interests.

Figures

Fig. 1
Fig. 1. Schematic illustration of disulfidptosis induced by GOx/CuSAE.
a Synthesis of GOx/CuSAE enzyme hybrid. Step 1: preparation of CuSAE by coating polydopamine (PDA) on SiO2 nanoparticles, followed by pyrolysis and hydrofluoric acid etching. Step 2: conjugation of GOx to CuSAE through DSPE-PEG-NH2. b Cellular response of GOx/CuSAE to induce disulfidptosis. GOx/CuSAE cuts off the intracellular pentose phosphate pathway by consuming glucose, blocking NADPH production, depleting existing NADPH, leading to abnormal accumulation of large excessive disulfide bonds in tumor cells and initiating disulfidptosis, featured by cytoskeleton shrinkage. Parts of the graphic elements were generated by Figdraw (www.figdraw.com).
Fig. 2
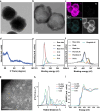
Fig. 2. Characterization of CuSAE.
a A representative TEM image of SiO2@PDA@Cu. Seven images were recorded and show similar results. b A representative TEM image of CuSAE. Images were recorded on three independent samples and show similar results. c A representative EDS element mapping of CuSAE. Three images were recorded and show similar results. d XRD spectrum of CuSAE. e, f XPS spectra of CuSAE; e the C 1s region, f the N 1s region. XPS measurements revealed graphitic-N, pyrrolic-N, and pyridinic-N as dominant nitrogen species in CuSAE. g HAADF-STEM image of CuSAE. White circles indicate single Cu atoms. Three images were recorded and show similar results. h, i X-ray absorption fine structure analysis of CuSAE; h Fourier-transformed EXAFS signal of CuSAE and reference samples; i XANES spectra at Cu K-edge of CuSAE and reference samples. Source data are provided as a Source Data file.
Fig. 3
Fig. 3. Enzymatic characterization of GOx/CuSAE.
a, b Measuring NOx-like activity of CuSAE based on the conversion of NADPH. The experiment was performed by incubation of 200 μg/mL NADPH with different concentrations of CuSAE (0–100 μg/mL) (a) or different pH (7.4, 6.0, and 4.5) (b). After incubation for 30 min, the concentration of the remaining NADPH was measured based on its absorption at 340 nm. c EPR spectra detecting O2•- by using 1,3-diphenylisobenzofuran as a trapping agent. The experiment was performed on 100 μg/mL CuSAE and 200 μg/mL NADPH. d, e POD-like activity of CuSAE measured with TMB chromogenic assay at different pH (d) or different concentration of CuSAE (e). f EPR spectra detect •OH radical by using 1,3-diphenylisobenzofuran as a trapping agent. The assay was performed on 10 mM H2O2 and 60 μg/mL CuSAE. g GSHOx-like activity of CuSAE measured with DTNB assay. The assay was performed on GSH (0.15 mM) and different concentrations of CuSAE (0–90 μg/mL) in the presence of DTNB (2.5 mM). The peak at 412 nm indicates the reduced TNB from GSH reduction. h pH variation in the GOx/CuSAE-catalyzed oxidation of glucose. The reaction was performed by incubation of GOx/CuSAE (80 μg/mL) with different concentrations of glucose for 12 h. i Catalytic activities of free GOx and GOx/CuSAE after storage. GOx (80 μg/mL) and GOx/CuSAE (with 80 μg/mL GOx) were incubated in weakly acidic conditions (pH 6.0) at 37 °C for different times. After the incubation, their catalytic activity was analyzed by incubation with glucose (10 mM) for 2 h, and the generation of H2O2 production was measured titanium sulfate assay. Data are shown as mean ± s.d. from three independent measurements. For statistical analyses, One-way ANOVA Dunnett correction (a, d, e, and h), or Two-sided Student’s t-test (i) was used on the results from three independent experiments (n  =  3). Source data are provided as a Source Data file.
Fig. 4
Fig. 4. DFT calculation on the enzymatic process of CuSAE.
a Schematic diagram of the NADPH oxidation process of CuSAE. R denotes the adenine dinucleotide phosphate group of NADPH/NADP+. b The Gibbs free energy diagram of the NADPH oxidase-mimicking catalytic process of C–N substrates and CuSAE. Source data are provided as a Source Data file.
Fig. 5
Fig. 5. GOx/CuSAE induces disulfidptosis of tumor cells.
a Cellular uptake of CuSAE. The assay was performed on 4T1 cells treated with red fluorophore (RF)-labeled RF@CuSAE for 5 h (in red fluorescence). Nucleuses were stained blue by Hoechst 33342. b Viability of 4T1 cells at 24 h post-treatment with CuSAE or GOx/CuSAE. Two-sided Student’s t-test was used in the statistical analysis on the data from three biologically independent experiments (n = 3), giving P = 0.0133 for the samples of 100 μg/mL CuSAE v.s. 0 μg/mL CuSAE, and P = 0.0027 for the samples of 100 μg/mL GOx/CuSAE v.s. 0 μg/mL GOx/CuSAE. c Glucose uptake levels in 4T1 cells treated with CuSAE and GOx/CuSAE (in 20 μg/mL CuSAE) for 24 h. One-way ANOVA, Dunnett correction was used in the statistical analysis on the results from three biologically independent experiments (n = 3), giving P = 0.0003 for the samples of GOx/CuSAE v.s. Control. d NADPH level in 4T1 cells treated with CuSAE or GOx/CuSAE (in 20 μg/mL CuSAE) for 24 h. NADPH level refers to the [NADPH]/[NADPtotal] ratio relative to the control group. One-way ANOVA, Dunnett correction was used in the statistical analysis on the results from three biologically independent experiments (n = 3), giving P = 0.0274 for the samples of GOx/CuSAE v.s. Control. e Western blotting analysis of disulfide formation of actin cytoskeleton proteins in 4T1 cells treated with CuSAE or GOx/CuSAE (in 20 μg/mL CuSAE) for 24 h. Reducing western blotting analyses were also performed by adding reducing agent β-mercaptoethanol to reduce disulfide bonds of the proteins. f 4T1 cells were treated with CuSAE or GOx/CuSAE (in 20 μg/mL CuSAE) for 24 h (red: F-actin, blue: nucleus). g Fluorescent staining of F-actin and membrane of the cells after being treated with CuSAE or GOx/CuSAE (in 20 μg/mL CuSAE) for 24 h (red: F-actin, green: membrane). h TEM imaging of 4T1 cells treated with GOx/CuSAE (in 20 μg/mL CuSAE) for 24 h. Data are shown as mean ± s.d. from three independent measurements. Experiments in (eh) were repeated independently three times, with similar results. Source data are provided as a Source Data file.
Fig. 6
Fig. 6. The effect of disulfidptosis on 4T1 cells with different SLC7A11 expression level.
a, b Viability of 4T1 cells with different SLC7A11 expression levels treated with CuSAE (a) and GOx/CuSAE (b) for 24 h. Two-sided Student’s t-test was used in the statistical analysis on the data from three biologically independent experiments (n = 3), giving P = 0.0004 for the samples of SLC7A11control v.s. SLC7A11low treated with 100 μg/mL CuSAE, P < 0.0001 for the samples of SLC7A11control v.s. SLC7A11high treated with 100 μg/mL CuSAE, and P < 0.0001 for the samples of SLC7A11control v.s. SLC7A11high and the samples of SLC7A11control v.s. SLC7A11high treated with 100 μg/mL GOx/CuSAE. c Western blotting of actin of 4T1 cells with different SLC7A11 expression levels treated with GOx/CuSAE (in 20 μg/mL CuSAE) for 24 h. “+“ refers to protein samples of cells treated with GOx/CuSAE. 1, 2, 3 refer to SLC7A11control, SLC7A11low and SLC7A11high cells respectively. d F-actin imaging of 4T1 cells with different SLC7A11 expression levels treated with CuSAE and GOx/CuSAE (in 20 μg/mL CuSAE) for 24 h. e Fluorescent staining of F-actin and membrane of 4T1 cells with different SLC7A11 expression levels treated with CuSAE and GOx/CuSAE (in 20 μg/mL CuSAE) for 24 h. Experiments of (ce) were repeated independently three times, with similar results. Data are shown as mean ± s.d., and all measurements are independent. Source data are provided as a Source Data file.
Fig. 7
Fig. 7. Ferroptosis-associated response of tumor cells treated by GOx/CuSAE.
a Intracellular ROS levels. 4T1 cells were treated with CuSAE or GOx/CuSAE (in 40 μg/mL CuSAE) for 6 h, and ROS was detected using DCFH-DA staining. b Fluorescence imaging to analyze mitochondrial depolarization of cells treated with CuSAE or GOx/CuSAE (in 20 μg/mL CuSAE) for 24 h. Mitochondria were stained with the JC-1 kit. c TEM imaging of the morphology of the cells treated with GOx/CuSAE (in 20 μg/mL CuSAE) for 24 h. The white arrows point to the mitochondria. d Lysosomal images of the cells treated with CuSAE or GOx/CuSAE (in 40 μg/mL CuSAE) for 6 h. Cells were stained with AO before imaging (red: lysosome, green: cytoplasm, and nucleus). e Western blotting analysis of GPX4 in the cells treated with CuSAE or GOx/CuSAE (in 20 μg/mL CuSAE) for 24 h. The blots of GPX4 and GAPDH were obtained from the same samples, run on separate gels with identical processing and the same molecular weight markers. The whole image is provided in Supplementary Fig. 36. f GSH level of the cells treated with CuSAE or GOx/CuSAE (in 20 μg/mL CuSAE) for 24 h. P < 0.0001 for the samples of GOx/CuSAE v.s. Control. g Lipid peroxide (LPO) measured by BODIPY-C11 stained in the cells treated with CuSAE or GOx/CuSAE (in 20 μg/mL CuSAE) for 12 h. (green: LPO, blue: nucleus). h MDA level of the cells treated with CuSAE or GOx/CuSAE (in 20 μg/mL CuSAE) for 12 h. P = 0.0002 for the samples of GOx/CuSAE v.s. Control. Data are shown as mean ± s.d. from three independent measurements. For both statistical analyses, One-way ANOVA, Dunnett correction was used on the results from three biologically independent experiments (n  =  3). Experiments of (ad) were repeated independently three times, with similar results. Source data are provided as a Source Data file.
Fig. 8
Fig. 8. Targeted quantitation of metabolites by LC-MS/MS.
a Heat map showing intracellular levels of metabolites in GOx/CuSAEs-treated 4T1 cells (n  =  3 biologically independent experiments per group). All these metabolites were clustered into the substrates cluster and the products cluster. Cluster method, K-means. b PCA analysis between the Control group and the GOx/CuSAE group of all the target metabolites determined in the assay. c Pathway enrichment analysis of differential metabolites. The X axis represents the impact factor of the pathway topology analysis, and the Y axis represents the P value of the pathway enrichment analysis (−ln P value). d Predicted metabolite sets enrichment analysis of differential metabolites. The X axis represents the impact factor of the pathway topology analysis, and the Y axis represents the P value of the pathway enrichment analysis (−log10 P value). e The correlation between disulfide, MDA, GSH, and GPX4 levels and various metabolites. The disulfide, MDA, GSH, and GPX4 levels were obtained from the results in Fig. 7 and Supplementary Fig. 27. The Pearson’s r is calculated with Excel 2016 using the Pearson function. Asterisks denote P-values (<0.001 ***; <0.01 **; <0.05 *). The correlation coefficients are given in the Table. For statistical analyses, Two-sided Student’s t-test (ce) was used on the results from three biologically independent experiments (n  =  3). Source data are provided as a Source Data file.
Fig. 9
Fig. 9. In vivo antitumor efficacy of GOx/CuSAE.
a Schematic illustration of the treatment schedule. BALB/c mice were subcutaneously inoculated with 8 × 105 4T1 cells. Mice were randomly divided into four groups and intravenously injected when the tumor grew to approximately 70 mm3, and injected intravenously with PBS, GOx (0.25 mg/kg), CuSAE (25 mg/kg), and GOx/CuSAE (0.25 mg GOx and 25 mg CuSAE /kg) every two days. The body weight and tumor volume of the mice were recorded every other day. Parts of the graphic elements were generated by Figdraw (www.figdraw.com). b Tumor volume of mice during the treatment. P < 0.0001 for mice treated with GOx/CuSAE v.s. Control (n = 6). c Tumor volume of each mouse during the treatment. d Tumor weight of mice after administration. P < 0.0001 for mice treated with GOx/CuSAE v.s. Control (n = 6). e H&E staining of cells of tumors. f Immunohistochemistry staining to detect Ki67-positive proliferative cells in the tumors after treatment. g Glucose level in tumors of mice after treatment. P < 0.0001 for mice treated with GOx/CuSAE v.s. Control (n = 3). h NADPH level in tumors of mice after administration. NADPH level refers to the [NADPH]/[NADPtotal] ratio relative to the PBS group. P < 0.0001 for mice treated with GOx/CuSAE v.s. Control (n = 3). i Immunohistochemistry staining to detect GPX4-positive cells in the tumors after treatment. Data are shown as mean ± s.d. from independent measurements. For all statistical analyses, One-way ANOVA, Dunnett correction was used on the results from biologically independent experiments. Source data are provided as a Source Data file.

References

    1. Kalyanaraman, H., Zhuang, S., Pilz, R. B. & Casteel, D. E. The activity of cGMP-dependent protein kinase Iα is not directly regulated by oxidation-induced disulfide formation at cysteine 43. J. Biol. Chem.292, 8262–8268 (2017). - PMC - PubMed
    1. Carelli, S. et al. Cysteine and glutathione secretion in response to protein disulfide bond formation in the ER. Science277, 1681–1684 (1997). - PubMed
    1. Liu, X. et al. Cystine transporter regulation of pentose phosphate pathway dependency and disulfide stress exposes a targetable metabolic vulnerability in cancer. Nat. Cell Biol.22, 476–486 (2020). - PMC - PubMed
    1. Liu, X. et al. Actin cytoskeleton vulnerability to disulfide stress mediates disulfidptosis. Nat. Cell Biol.25, 404–414 (2023). - PMC - PubMed
    1. Zheng, T., Liu, Q., Xing, F., Zeng, C. & Wang, W. Disulfidptosis: a new form of programmed cell death. J. Exp. Clin. Cancer Res.42, 137 (2023). - PMC - PubMed

MeSH terms

LinkOut - more resources