. 2025 May 26;8(1):812.
doi: 10.1038/s42003-025-08242-1.

Oral 8-aminoguanine against age-related retinal degeneration

Affiliations

Oral 8-aminoguanine against age-related retinal degeneration

Abhishek Vats et al. Commun Biol. .

Abstract

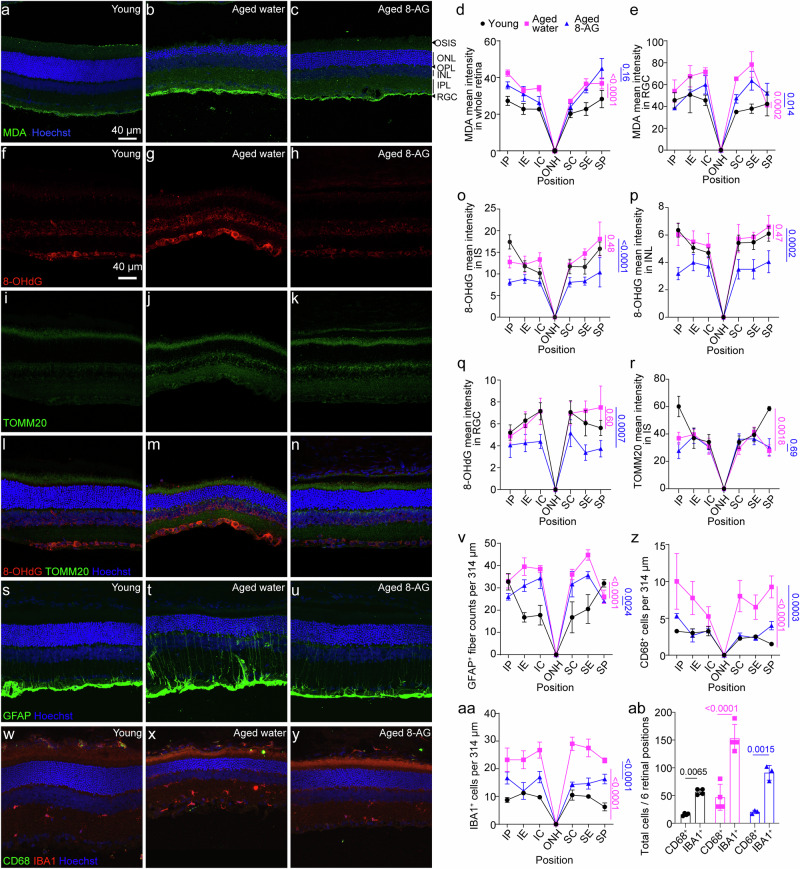
Vision decline in the elderly, often due to retinal aging, predisposes individuals to pathologies like age-related macular degeneration. Currently, there are few effective oral treatments for this condition. Our study introduces an oral agent, 8-aminoguanine (8-AG), which targets age-related retinal degeneration using an aged Fischer 344 rat model. When administered in drinking water at a low dose for 8 weeks starting at 22 months of age, 8-AG significantly preserves retinal structure and function, as evidenced by increased retinal thickness, enhanced photoreceptor integrity, and improved electroretinogram responses. 8-AG reduces apoptosis, oxidative damage, and microglial/macrophage activation in aging retinae. 8-AG also mitigates retinal inflammation at transcriptional and cytokine levels. Extending treatment to 17 weeks further amplifies these protective effects. Given its efficacy in various disease models, 8-AG shows great promise as an anti-aging compound with the potential to mitigate common hallmarks of aging.


Conflict of interest statement

Competing interests: Chen Y. is a co-inventor of patents and pending patents: US11,744,826 and 11,191,752. Jackson E. is a co-inventor on issued US patents 10,729,711 and 11,103,526. Jackson E., Birder L., and Wolf-Johnston A. are co-inventors on pending patents US17/434,894, EPO21792357.2, and PCT/US2022/042471. Jackson E., Birder L., Wolf-Johnston A., and Chen Y. are co-inventors on the pending patent US17/799,546, which is associated with this study.

Figures

Fig. 1
Fig. 1. Oral 8-aminoguanine rescues the aged Fischer 344 (F344) rat retinae from degeneration.
a An illustration shows the degradation of purine nucleosides. The tissue-protecting purines are highlighted in green, and tissue-damaging purines are marked in a pink background. The 8-AG shown in blue is an inhibitor of PNPase. b Stability of 8-AG in water at room temperature for 3 days using HPLC, showing only slight decay of 8-AG from 22 to 17 μg/mL in 24 h. N = 3. Data are shown as mean ± SD. c Treatment regimen and experiments using the F344 rats. Young rats were 3 months old, aged rats were 22 months old when started on a daily 8-AG supplement in water for 8 weeks. The spectral domain-optic coherence tomography (SD-OCT) and electroretinogram (ERG) were collected at baseline and endpoint. At the endpoint, the animals were euthanized for histology, purine metabolome, and RNA-seq studies. dg are ERG results. d Representative scotopic ERG responses at 1 cd s/m2. eg are the semi-log plots of scotopic a, b-wave and photopic b-wave responses in µV as a function of flash intensities (cd s/m2) for water and 8-AG treated F344 rats at the endpoint. Data from 8-AG treated and water-treated animals were shown in blue triangles and magenta squares, respectively, as means ± SEM. N = 8. hj are SD-OCT results. h Representative B-scans of water-treated (upper panel) and 8-AG-treated (lower panel) rats at the endpoint. The vertical and horizontal scale bars are 50 and 100 µm, respectively. i, j The spidergrams of the thickness of the outer nuclear layer (ONL) and outer-inner segment layer (OSIS), respectively, measured from SD-OCT B scans. Data from the water-treated group are shown in light and dark magenta for baseline and endpoint, respectively, and those from the 8-AG-treated group are shown in light and dark blue for baseline and endpoint results, respectively. N = 8. Data are shown as means ± SEM. ko are the retinal hematoxylin and eosin (H&E) staining results. k Representative H&E staining images at central (SC&IC), equatorial (SE&IE) and peripheral (SP&IP) regions of retinal paraffin sections on the inferior (I) side of optic nerve head (ONH). Scale bar, 50 μm. OS + IS, outer and inner segments; ONL outer nuclear layer, OPL outer plexiform layer, INL inner nuclear layer, IPL inner plexiform layer, RGCs retinal ganglion cells. lo Spidergrams of measurements from H&E staining images as shown in k, including total thickness of all retinal layers (l), cell number in ONL per 200 µm length of the retinal section (m), thickness of OS + IS (n), number of cells in the retinal ganglion cells (RGC) per 200 μm length of the retinal section o. Data from young, water-treated aged and 8-AG-treated aged rats are shown in black circles, magenta squares, and blue triangles, respectively. N = 8. Statistical analysis for ERG, OCT, and histology data was performed using two-way ANOVA. The black bracket or line shows the P between water and 8-AG-treated groups at endpoint; the magenta bracket/line shows the P comparing the water-treated group at baseline and endpoint; and the blue line shows the P comparing the 8-AG-treated group at baseline and endpoint. ns is for non-significant. Data points and error bars are means and SEMs, respectively.
Fig. 2
Fig. 2. 8-AG treatment reduces apoptosis and protects photoreceptors in aged F344 rats.
The young (3 months), water-treated aged (24 months), or aged F344 rats treated with 8-AG for 8 weeks (24 months) were euthanized, and eyes were enucleated and prepared for immunohistochemistry or immunoblots. ac are representative TUNEL-stained immunofluorescence images for young (a), water-treated aged (b), and 8-AG-treated aged rats (c), respectively, at the superior equatorial region of the retina sections, TUNEL+ cells are in green, and nuclei are stained with Hoechst33b342 in blue. Scale bar, 50 μm. d The Spidergrams of TUNEL+ cell numbers at different positions of the retinae. N = 3-4. e Immunoblots against the cleaved (top, 17, and 19 kDs) and intact caspase-3 (middle, 30 kDa) from rat retinal lysates. Ponceau stain (bottom) was used as the loading control. Each lane represents one rat retina. * Marks the excluded sample due to abnormal Ponceau stain. f. Bar plot of the band intensity ratio of cleaved: intact caspase-3. N = 7, 8, and 5 for young, water-treated aged, and 8-AG-treated aged F344 rat retinae. Data and error bars are means ± SDs. gi Immunofluorescence images of rhodopsin (RHO, red) and Hoechst33342 for nucleus (blue) at superior central (SC) region of retinal cryosections of young (g), aged water-treated (h), and aged 8-AG-treated rats i. Scale bar, 50 μm. j The spidergram of RHO immunofluorescence intensity in the OS at different positions of the retinae. N = 8, 8, and 7 for young, water-treated aged, and 8-AG-treated-aged group, respectively. k Immunoblot of RHO from rat retinae. Each number represents one rat retina. Arrowheads show tetramer, dimer, and monomer of RHO from top to bottom, respectively. l Bar graph of RHO immunoblot intensity normalized by loading control. N = 8. mo. Immunofluorescence images of peanut agglutinin (PNA, a marker of cones) and Hoechst33342 for nucleus (blue) at inferior central regions of retinal cryosections of young (m), aged water-treated (n) and aged 8-AG treated rats (o). Scale bar, 40 μm. N = 8. p The spidergram of PNA+ cone numbers at different positions of the retinae. Black circles, young rats; magenta squares, aged rats; blue triangles, aged rats treated with 8-AG. For spidergrams, data points and error bars are means and SEMs, and P values were calculated by two-way ANOVA. For the bar graph, column, and error bars are means and SDs, and P values were calculated by Kruskal–Wallis. Pink lines show P comparing the water-treated aged vs. young control, and blue lines show P comparing the 8-AG-treated aged vs. water-treated aged control.
Fig. 3
Fig. 3. 8-AG reduces retinal tissue oxidation and activation of Müller and microglia in aged F344 rat retinae.
Twenty-two-month-old F344 rats were treated with 8-AG in water or water only for 8 weeks. The 3-month-old young rats are used as controls. The 24-month-old rats were euthanized, and eyes were isolated for immunohistochemistry against tissue oxidation and stress markers. ac Representative immunofluorescence images of malondialdehyde (MDA, in green), an indicator of lipid peroxidation, at superior central positions of the retinae from young (a), aged water treated (b), and aged 8-AG treated rats (c). Hoechst33342 stained the nucleus blue. Scale bar, 40 µm. d and e Spidergrams of MDA intensity in the whole retina and in retinal ganglion cell layer (RGC), respectively. N = 3. fn Representative immunofluorescence images of the 8-hydroxy-2’ -deoxyguanosine (8-OHdG, a marker for oxidated DNA in red) (fh), translocase of outer mitochondrial membrane 20 (TOMM20, a mitochondrial marker in green) (ik), and merged channel with Hoechst33342 (blue) (ln) on the superior central region of the retinal cryosections of young (f, i, l), water-treated aged (g, j, m) and 8-AG-treated aged rats (h, k, n). oq Spidergrams of immunofluorescence intensity of 8-OHdG on the inner segment layer (IS) (o), inner nuclear layer (INL) (p), and RGC layer (q), respectively. r The spidergram of immunofluorescence intensity of TOMM20 in IS. N = 4, 5, 4 for young, water-treated aged, and 8-AG-treated aged groups, respectively. su Representative immunostaining images of glial fibrillary acidic protein (GFAP), as a marker of activated Müller glia in green, for young (s), water-treated aged (t), and 8-AG-treated aged rat retina (u). v The spidergram of GFAP+ fiber counts per 314 μm at different locations of retinae. N = 4, 4, 3 for young, water-treated aged, and 8-AG-treated aged group, respectively. wy Representative immunostaining images of the cluster of differentiation 68 (CD68, in green), ionized calcium-binding adaptor molecule 1 (IBA1, in red), both are markers of microglia/macrophages, from young (w), aged water treated (x), an aged 8-AG treated (y) at different retinal positions. Hoechst33342 stained nucleus in blue. Scale bar, 50 μm. z and aa are spidergrams of the counts of CD68+ cells (z), and IBA1+ cells (aa) per 314 μm at different retina positions. ab The bar plot of the total CD68+ and IBA1+ cells at six positions of the retinal cross-sections. Black circles, young group; magenta squares, water-treated aged group; blue triangles, 8-AG-treated aged group. N = 4, 4, 3 for young, water-treated aged, and 8-AG-treated aged group, respectively. Data points and error bars are means ± SEMs in the spidergrams, and means ± SDs in the bar graph. P values were analyzed by two-way ANOVA for the spidergrams and Kruskal–Wallis for the bar graph. Pink line show P comparing the water-treated aged vs. young control, and blue lines show P comparing the 8-AG-treated aged vs. water-treated aged control.
Fig. 4
Fig. 4. 8-AG reduces the number of phagosomes in aged F344 rat retina.
Young (3 m), water-treated aged (24 m), or 8-AG-treated aged F344 rats (24 m) were euthanized, and eyes were isolated and processed for transmission electron microscopy (TEM). ar Representative TEM images of young, aged, and aged 8-AG treated rat’s RPE (ac and jl), photoreceptor’s outer segment (OS) disc membrane (df and mo) and inner segment (IS) (gI and pr) at peripheral (ai) and central region (jr) of the retinae. ac and jl TEM images of RPE from the peripheral and central region, respectively, showing autophagosome (white arrowhead) and mitochondria (black asterisk). Scale bar, 1 µm. df and mo. TEM images showing the integrity of photoreceptors OS disc membrane at the peripheral and central retina, respectively. gi and pr TEM images of mitochondria (black asterisk) in the photoreceptor’s IS of the peripheral and central region of rat’s retina, respectively. s, t Bar graphs represent the number of phagosomes and mitochondria, respectively, in the RPE at the peripheral region of young (black circle), aged (magenta square), and aged 8-AG treated (blue triangle) rat’s retina. N = 6–7. Each data point is from one TEM image. Data points and error bars are means ± SD, and P values were analyzed by Kruskal–Wallis.
Fig. 5
Fig. 5. Transcriptomics reveal reduced immune and stress responses in 8-AG-treated rats.
Young, aged, and 8-AG-treated aged rats’ whole retinae were processed for transcriptomic analysis using bulk RNA-seq. The differentially expressed genes (DEGs) among aged untreated vs. young and aged 8-AG treated vs. aged untreated were identified which showed >1.5-fold changes with P values of <0.05. Significantly affected biological processes were identified by gene ontology (GO) analysis. N = 3. a, b are the biological pathways (BPs) of upregulated and downregulated DEGs, respectively, in the aged untreated vs. young rat’s whole retina. c, d are the BPs of downregulated and upregulated DEGs, respectively, in the aged 8-AG-treated vs. aged rat’s whole retina. X axis represents the percentage of genes in a gene set of certain BPs and the Y axis represents the BPs. On the right side, the labeling of all graphs lists the cellular pathways.
Fig. 6
Fig. 6. Transcriptomics of RPE/choroid reveals partial recovery of declined tight junctions and attenuation of upregulated inflammatory signals in 8-AG-treated rats.
RPE/choroids of young, aged, and 8-AG-treated aged rats were manually separated from the retinae were processed for transcriptomic analysis using bulk RNA-seq. Aged untreated vs. young and aged 8-AG treated vs. aged untreated DEGs were analyzed by GO to identify affected biological pathways (BPs). DEGs were identified with >1.5-fold changes with P values < 0.05. N = 3. a, b are up- and downregulated BPs, respectively, in RPEs/choroids from aged untreated vs. young rats. c, d are up and downregulated BPs, respectively, in RPEs/choroids in aged 8-AG-treated vs. aged untreated rats. The X axis represents the DEGs percentage in a gene set, and the Y axis represents the BPs. Right side of the graphs, shows the corresponding cellular pathways.
Fig. 7
Fig. 7. 8-AG reduces the expression of pro-inflammation genes, reduces the levels of pro-inflammatory cytokines, and affects the purine metabolome in F344 rat retinae.
Retina from young, water-treated aged, and 8-AG-treated aged rats were harvested, retinal lysates were used for qPCR, multiplex cytokine profiling using a flow-cytometer, and purine metabolome quantification using UPLC-MS/MS. af Transcript levels in the retinae for the following genes normalized with Gapdh level. N = 3. a Mt2a, b Adgre1, c Itgal, d Cd68, e Itgb2, and f Rt1-da. gl Retinal cytokine/chemokine levels normalized by net retina weight and calibrated by standard curves. N = 6. g IL-33, h GM-CSF, i IL-28, j IL-1-alpha, k MCP-1, and l IL12p-70 (the 70 kDa complex of IL-12). m A brief illustration reminding the salvage and degradation of purine nucleosides. The tissue-damaging purines are in red background; 8-aminoguanine (8-AG) shown in light blue background, is a PNPase inhibitor. nz Concentrations of retinal purine metabolites from young (black circle), water-treated aged (magenta square), and 8-AG-treated aged rats (blue triangle), normalized with the total protein in micrograms (ng of metabolite/µg of total protein). N = 4. n 8-AG; o Guanosine; p Adenosine; q Inosine; r 8-Aminoguanosine; s Guanine; t Adenine; u Hypoxanthine; v Xanthine; w 3’5’-cGMP; x 5’-GMP; y 3’5’-cAMP; z 5’-AMP. aa Dot plot of transcripts involved in the purine salvage and degradation pathway from young (black) and aged (magenta) rat retinae, using RNA-seq data. b Dot plot of transcripts involved in the purine salvage and degradation pathway from aged (magenta) and 8-AG-treated aged (blue) rat retinae, using the RNA-seq data. N = 3. Data and error bars are means±SDs. P values were calculated using One-way ANOVA for all the plots. ns stands for no significance.
Fig. 8
Fig. 8. Long-term efficacy of 8-AG in F344 rats.
The F344 rats were treated with 8-AG at 5 mg/kg bw daily in drinking water or with water only for 17 weeks starting at 23 months of age. SD-OCT and ERG were performed on rats at the endpoint at 27 months of age, followed by euthanasia for IHC. a, b The spidergrams for the thickness of OSIS and ONL, respectively, were measured from SD-OCT B-scans. c, d represent the temporal and nasal side of the retinae. Magenta squares, water-treated aged rats; and blue triangles, 8-AG-treated aged rats. ce ERG response for scotopic a-wave (c), scotopic b-wave (d), and photopic b-wave (e) plotted as a function of flash intensity in semi-log format. f Representative immunofluorescence images of RHO (red) and Hoechst33342 for nucleus stain (blue) at central (SC&IC), equatorial (SE&IE), and peripheral (SP&IP) regions of the aged untreated and aged 8-AG treated rat retinae. g, h Spidergrams of RHO intensity in the OSIS (g) and ONL thickness (i), measured from IHC images shown in f. Data points and error bars are means ± SEMs. N = 2 for untreated retinae, N = 4 for 8-AG for treated retinae. This dataset has a low sample size because the average rat lifespan is 24 months, only one or two animals survived till 27 months for each group. Therefore, P values were not shown.

Update of

References

    1. Gao, H. & Hollyfield, J. G. Aging of the human retina. Differential loss of neurons and retinal pigment epithelial cells. Invest. Ophthalmol. Vis. Sci.33, 1–17 (1992). - PubMed
    1. Curcio, C. A., Millican, C. L., Allen, K. A. & Kalina, R. E. Aging of the human photoreceptor mosaic: evidence for selective vulnerability of rods in central retina. Invest. Ophthalmol. Vis. Sci.34, 3278–3296 (1993). - PubMed
    1. Fleckenstein, M. et al. Age-related macular degeneration. Nat. Rev. Dis. Prim.7, 31 (2021). - PubMed
    1. Owsley, C., Swain, T. A., Kar, D. & Curcio, C. A. Rod mediated dark adaptation, a functional test for early and intermediate AMD outcomes. Expert Rev. Ophthalmol.19, 1–5 (2023). - PMC - PubMed
    1. Wong, W. L. et al. Global prevalence of age-related macular degeneration and disease burden projection for 2020 and 2040: a systematic review and meta-analysis. Lancet Glob. Health2, e106–e116 (2014). - PubMed

Grants and funding

LinkOut - more resources