. 2025 Jun;57(6):1437-1451.
doi: 10.1038/s41588-025-02172-8. Epub 2025 May 26.

Base editing of trinucleotide repeats that cause Huntington's disease and Friedreich's ataxia reduces somatic repeat expansions in patient cells and in mice

Affiliations

Base editing of trinucleotide repeats that cause Huntington's disease and Friedreich's ataxia reduces somatic repeat expansions in patient cells and in mice

Zaneta Matuszek et al. Nat Genet. 2025 Jun.

Abstract

Trinucleotide repeat (TNR) diseases are neurological disorders caused by expanded genomic TNRs that become unstable in a length-dependent manner. The CAG•CTG sequence is found in approximately one-third of pathogenic TNR loci, including the HTT gene that causes Huntington's disease. Friedreich's ataxia, the most prevalent hereditary ataxia, results from GAA repeat expansion at the FXN gene. Here we used cytosine and adenine base editing to reduce the repetitiveness of TNRs in patient cells and in mice. Base editors introduced G•C>A•T and A•T>G•C interruptions at CAG and GAA repeats, mimicking stable, nonpathogenic alleles that naturally occur in people. AAV9 delivery of optimized base editors in Htt.Q111 Huntington's disease and YG8s Friedreich's ataxia mice resulted in efficient editing in transduced tissues, and significantly reduced repeat expansion in the central nervous system. These findings demonstrate that introducing interruptions in pathogenic TNRs can mitigate a key neurological feature of TNR diseases in vivo.


Conflict of interest statement

Competing interests: Z.M., M.A. and D.R.L. have filed patent applications on this work. D.R.L. is a consultant, co-founder and/or equity owner of Beam Therapeutics, Prime Medicine, Pairwise Plants and nChroma Bio, companies that use or deliver genome or epigenome editing agents. The other authors declare no competing interests.

Figures
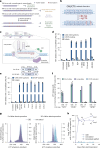
Fig. 1
Fig. 1. Synonymous cytosine base editing of CAG repeats in vitro.
a, An overview of the base editing approach to reduce triplet-repeat expansions. b, Schematic of the CAG-CBE base editing strategy. c, An illustration of cytosine base editing at CAG repeats. The smaller cartoon illustrates the multiple binding opportunities for the Cas9-sgCTG complex at CAG repeats. The magnified snippet shows a singular binding event. d, Optimization of cytosine base editing strategies in HEK293T cells. Data are mean ± s.d. of biological triplicates. e, Optimization of the ‘GS’ linker of EA-evoA-Cas9-NG in HEK293T cells. Data are mean ± s.d. of biological triplicates. f, CAG repeat base editing at HTT alleles in human fibroblasts. Numbers below the bars indicate the number of CAG repeats (CAG size) in HTT alleles. Data are mean ± s.d. of biological replicates (n = 2 for HD cell lines with 20/48 and 17/71 CAGs, n = 3 for HD cell lines with 15/16 and 18/180 CAGs). g, Distribution of HTT CAG allele sizes in CBE-treated (CBE) and untreated HD fibroblasts with 18/180 CAG repeats in Rep1, 5 d (P1) and 30 d (P5) after electroporation, as measured by fragment analysis. h, CAG repeat base editing in HD fibroblasts with 18/180 CAG repeats measured across 30 d and five cell passages. P1–P5 refer to cell passages 1–5. Rep1 and Rep2 refer to two independent biological replicates. Illustrations in a, c and e were created using BioRender.com. CBE, CBE-treated; UGI, uracil DNA glycosylase inhibitor domain; UT, untreated cells. Source data
Fig. 2
Fig. 2. Alternative target and off-target editing analysis of CAG-CBE strategy.
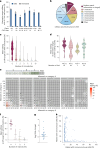
a, Base editing at TNR disease-associated genes in HEK293T cells. Data are mean ± s.d. of biological triplicates, except for AR (n = 5) and ATXN2 (n = 4). b, CIRCLE-seq off-target hits in the human genome classified by the number of mismatches with sgCTG. ce, Alternative target and off-target editing at CIRCLE-seq sites in HEK293T cells, quantified by WGS. c, Violin plot representing mean base editing frequencies at CIRCLE-seq sites (>0.5% editing by WGS), classified by mismatch number. Median and quartiles are shown. d, Alternative target editing at protein-coding sites in HEK293T cells, grouped by encoded amino acids. Median and quartiles are shown; each dot represents mean editing at a specific locus. e, Base editing at CIRCLE-seq sites (>0.5% editing by WGS) and grouped by mismatch position relative to sgCTG spacer. Mean editing (%) represents base editing frequency across genomic sites meeting the specified mismatch criteria. Mismatch category A includes the five nucleotides closest to the PAM (positions 1–5), category B represents positions 6–10 and category C spans the last ten, PAM-distal nucleotides (positions 11–20) of the protospacer. A0–A5, B0–B5 and C0–C10 indicate the number of mismatches (0–5) between the sgCTG and a target site in categories A, B and C. Each square shows the number of loci with >0.5% editing in each mismatch subgroup. f, Editing at protein-coding sites with 0–3 mismatches between the sgCTG and a target site in HEK293T cells, measured by HTS. Each dot represents mean editing at a unique locus; disease-associated genes are colored diamonds. Data are mean ± s.d. of all loci in each category. g, Comparison of editing quantified by WGS and HTS at selected sites. Each dot represents the log2 fold-change between editing frequencies quantified by WGS and HTS at a single locus, with the horizontal line indicating median (n = 22, P = 0.0045, one-sample t-test and Wilcoxon test). h, Impact of CAG repeat editing on amino acid sequence at protein-coding genes. The scatterplot shows the percentage of synonymous (y axis) and nonsynonymous (x axis) editing at edited alleles for each protein-coding gene. Each dot represents mean editing calculated for all loci mapping to a unique gene. Data in ch represent biological triplicates. Poly-A, polyalanine; Poly-L, polyleucine; Poly-S, polyserine. Source data
Fig. 3
Fig. 3. Cytosine base editing of HTT CAG repeats in Htt.Q111 mice.
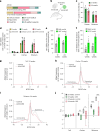
a, Dual-AAV vectors encoding split-intein EA-evoA-32NLS-NG and sgCTG cassettes, v5 AAV9-CBE. b, Neonatal ICV injections in Htt.Q111 mice with AAV9-CBE, and AAV9-GFP as a transduction control. c, Transduction efficiency in the cortex and striatum of Htt.Q111 mice treated with AAV9-CBE + AAV9-GFP. Data are mean ± s.d. of independent animals (12-week, n = 6; 24-week, n = 7). d, Base editing in the CNS of Htt.Q111 mice treated with AAV9-CBE, or controls. Editing was quantified at 4, 12 and 24 weeks postinjection. Data are mean ± s.d. of independent animals (4-week, n = 3; 12-week, n = 6; 24-week, n = 7). e,f, Base editing in bulk and GFP+ flow-sorted nuclei isolated from the cortex (e) or striatum (f) of Htt.Q111 mice treated with AAV9-CBE + AAV9-GFP at 12 and 24 weeks postinjection. Data are mean ± s.d. of independent animals (12-week, n = 6; 24-week, n = 7). gi, Distribution of CAG allele sizes in the tail (g), cortex (h) and striatum (i) isolated from 24-week-old Htt.Q111 mice treated with AAV9-CBE, or controls. The dashed vertical line marks the modal HTT CAG allele determined from the tail. Data show mean CAG repeat size distributions from at least four independent animals (tail: untreated n = 4, CBE n = 11; striatum: untreated n = 7, CBE n = 7; cortex: untreated n = 8, CBE n = 7). j, ICAG calculated for the tail, cortex and striatum isolated from 12- and 24-week-old Htt.Q111 mice treated with AAV9-CBE, or controls. Data are shown as box plots, with each data point representing an independent animal (12 weeks, control group: tail n = 8, striatum n = 8; cortex n = 4; 12 weeks, CBE group: cortex n = 6, striatum n = 6, tail n = 5; 24 weeks, control group: tail n = 8, cortex n = 8, striatum n = 7; 24 weeks, CBE group: all tissues n = 7). The horizontal line marks the median, and whiskers denote the minimum and maximum values. *P = 0.0265, **P = 0.0064, ***P = 0.0009, Welch’s one-tailed t-test. Illustrations in a and b were created using BioRender.com. Source data
Fig. 4
Fig. 4. Adenine base editing of FXN GAA repeats in vitro.
a, Illustration of adenine base editing at GAA repeats (top) and schematic of the editing strategy (bottom). A smaller cartoon illustrates multiple binding opportunities for the Cas9-sgGAA complex at GAA repeats, with a magnified view showing a single binding event. b, Optimization of adenine base editing in HEK293T cells. Sequences below the bar plot indicate the NNNN PAM sequences compatible with sgGAA spacer. Data are mean ± s.d. of biological triplicates. c, Comparison of AGAA PAM-targeting ABE8e strategies in FXN-mESCs, evaluated across 30 (FXN-30GAA-mES) and 50 (FXN-60-GAA-mES) GAA repeats. Data are shown as mean ± s.d. of biological triplicates. d,e, CIRCLE-seq off-target hits in the human genome classified by the identity of the targeted region annotated with HOMER (d) and the number of mismatches with the sgGAA (e). f,g, Alternative target and off-target editing at CIRCLE-seq sites in HEK293T cells, confirmed by WGS (>0.5% editing) and classified based on the number (f) and the location (g) of mismatches relative to the sgGAA spacer. Horizontal lines in f mark median and quartiles calculated for all loci in a specific group. Editing for each locus is a mean of triplicates. Mean editing (%) in g represents base editing frequency across genomic sites meeting the specified mismatch criteria. Mismatch category A includes the five nucleotides proximal to PAM (positions 1–5), category B represents positions 6–10 and category C spans the last ten, PAM-distal nucleotides (positions 11–20) of the protospacer. A0–A5, B0–B5 and C0–C10 indicate the number of mismatches (0–5) between the sgGAA and a target site in categories A, B and C. Each square shows the number of loci with >0.5% editing in each mismatch subgroup. h, Editing frequencies at CIRCLE-seq sites with 0–4 mismatches between the sgGAA and a target site in HEK293T cells, measured by HTS. Each dot shows mean editing at a unique locus; diamonds indicate protein-coding sites. Data are mean ± s.d. of all loci in each category. Data in fh represent biological triplicates. Illustration in a was created using BioRender.com. TSS, transcription start site; UTR, untranslated region. Source data
Fig. 5
Fig. 5. Adenine base editing of FXN GAA repeats in patient cells and in YG8s mice.
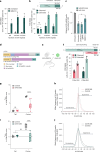
a, Base editing of FXN GAA repeats in control and FRDA patient-derived fibroblasts. Numbers below the bar plot indicate the size of GAA repeats in each cell line. Data are mean ± s.d. of biological triplicates. b, Observed and estimated FXN GAA repeat editing in control and FRDA patient-derived fibroblasts, normalized to untreated controls. Data are mean ± s.d. of biological triplicates. NS, not significant, Welch’s two-tailed t-test. c, FXN mRNA expression in human fibroblasts treated with ABEdCH or in controls, 12 d after electroporation, normalized to TBP levels. Data are mean ± s.d. of biological triplicates. *P = 0.017, Welch’s one-tailed t-test. d, Dual-AAV vectors encoding split-intein ABE8e-dNRCH and sgGAA cassettes, v6 AAV9-ABE. e, Neonatal ICV injections in YG8s mice with AAV9-ABEdCH. f, FXN GAA repeat editing in the cortex of YG8s.300 and YG8s.800 mice treated with AAV9-ABEdCH at 24 weeks postinjection, as observed in HTS or estimated, normalized to uninjected controls. Data are mean ± s.d. of independent animals (YG8s.300 n = 10, YG8s.800 n = 7). g,h, IGAA (g) and mean distribution of GAA allele sizes (ΔGAA size) (h) in the cortex isolated from 24-week-old YG8s.300 mice treated with AAV9-ABEdCH, or controls. i,j, IGAA (i) and mean distribution of GAA allele sizes (ΔGAA size) (j) in the cortex isolated from 24-week-old YG8s.800 mice treated with AAV9-ABEdCH, or controls. Data in g and i are shown as box plots, with each data point representing an independent animal (YG8s.300: untreated n = 6, ABE n = 10; YG8s.800: untreated n = 6, ABE n = 7). The horizontal line marks the median, and whiskers represent the minimum and maximum values. ****P < 0.0001, Welch’s one-tailed t-test. h,j, Mean GAA repeat size distributions from at least four independent animals (YG8s.300: untreated n = 6, ABE n = 10; YG8s.800: untreated n = 4, ABE n = 8). The dashed line marks the modal FXN GAA allele determined from the tail. Illustrations in d and e were created using BioRender.com. Source data
Extended Data Fig. 1
Extended Data Fig. 1. Synonymous cytosine base editing of CAG repeats in vitro.
(a) Optimization of cytosine base editing strategies in HEK293T cells. Data are mean ± SD of biological triplicates. (b-c) Cumulative mean % of interrupted HTT alleles with at least a specified number of CAA interruptions induced by EA-evoA-NG in (b) HEK293T and (c) HD fibroblasts (GM04855, 20/48 CAGs). Data are mean ± SD of biological replicates ((b) n = 3, (c) n = 2). (d) Distribution of CAA interruptions throughout CAG repeats in GM04855 fibroblasts (20/48 CAGs) at interrupted HTT alleles represented as % interrupted alleles with CAA interruptions at a given position of the repeat tract. Data are mean ± SD of two biological replicates. (e) CAG repeat base editing at the pathogenic HTT allele in HD fibroblasts with 180 CAG repeats (GM09197) quantified in 5’- > 3’ (spanning 59 CAGs) and 3′- > 5′ (spanning 81 CAGs) sequencing direction. Data are mean ± SD of two biological replicates. (f) A representative agarose gel showing the distribution of CAG allele sizes in CBE-treated (CBE) and untreated HD fibroblasts with 180 CAG repeats (GM09197); P – passage, L – ladder. The dashed lines indicate the starting CAG size. The experiment was performed twice with similar results. (g-h) CIRCLE-seq nominated off-target hits in the human genome classified by (g) the identity of the targeted region annotated with HOMER and (h) number of mismatches of the protein-coding sites with the sgCTG. TSS-transcription start site, TTS-transcription termination site. Source data
Extended Data Fig. 2
Extended Data Fig. 2. In-silico off-target analysis for CAG repeat-targeting strategy.
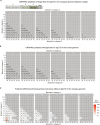
(a-b) CRISPRitz-predicted off-target candidate sites in the (a) macaque (Macaca mulatta) and (b) human genomes organized based on the position of mismatches between the genomic site and sgCTG spacer sequence. Mismatch category A includes the five nucleotides most proximal to the PAM (positions 1-5), category B represents positions 6-10, and category C spans the last ten, PAM-distal nucleotides (positions 11-20) of the protospacer. A0-A5, B0-B5 and C0-C10 indicate the number of mismatches (0-5) between the sgCTG and a target site in categories A, B or C. Each square shows the number of loci in each mismatch subgroup. (c) Predicted in cellulo base editing off-target activity of our CBE strategy in the macaque genome, based on in silico CRISPRitz predictions of off-target edits and a subsequent WGS-transformation using the ratio of off-targets edited in HEK293T cells ( > 0.5% editing by WGS) versus predicted by CRISPRitz in the human genome. Heatmap colors represent predicted in cellulo editing per mismatch bin, based on corresponding editing frequencies per bin observed in WGS analysis of edited HEK293T cells.
Extended Data Fig. 3
Extended Data Fig. 3. Cytosine base editing of HTT CAG repeats in Htt.Q111 mice.
(a) Cumulative mean % interrupted HTT alleles with at least a specified number of CAA interruptions in the cortex of AAV9-CBE-treated Htt.Q111 mice at 4-, 12- and 24-weeks post-injection. Mean ± SD (4 weeks n = 4, 12 weeks n = 6, 24 weeks n = 7). (b) CAG-CBE editing in Htt.Q111 mice quantified in 5′- > 3′ and 3′->5′sequencing directions. Mean ± SD (CBE n = 3, untreated n = 4). (c) Expansion (ICAG(e), positive) and contraction (ICAG(c), negative) indices in tail, cortex and striatum of 12- and 24-week-old Htt.Q111 mice treated with AAV9-CBE, or controls. Box plots of independent animals (Tail: untreated n = 4, CBE n = 5; Striatum: untreated n = 4, CBE n = 6; Cortex: untreated n = 4, CBE n = 6). Median indicated by horizontal line, whiskers show min-max values. **P = 0.007, ***P = 0.0003, ****P < 0.0001, Welch’s one-tailed t-test. (d-f) CAG allele sizes in (d) tail, (e) cortex and (f) striatum of 12-week-old Htt.Q111 mice treated with AAV9-CBE, or controls. Dotted line indicates modal HTT allele. Mean distributions (Tail: untreated n = 8, CBE n = 5; Striatum: untreated n = 8, CBE n = 6; Cortex: untreated n = 4, CBE n = 6). (g) Frameshifting indels in AAV9-CBE-treated Htt.Q111 mice, 12- and 24-weeks post-treatment. Mean ± SD (untreated n = 3, 12 weeks n = 6, 24 weeks n = 7). (h) Fraction of interrupted HTT alleles with frameshifting indels in AAV9-CBE-tretaed Htt.Q111 mice at 12 and 24 weeks post-treatment. Mean ± SD (12 weeks n = 6, 24 weeks n = 7). (i) Frameshifting indel sequences (G, A and AG) at CAG repeats in cortex and striatum of Htt.Q111 mice, 12- and 24-weeks post-injection. Corresponding amino acid sequences (Poly-S – polyserine, Poly-A – polyalanine) noted. Median shown by horizontal line, min-max range by vertical lines (n = 26). (j) Frameshifting indels in HD fibroblasts (GM09197) treated with CBE. Mean ± SD (untreated n = 4, CBE n = 3). (k-l) CIRCLE-seq off-target hits in the mouse genome classified by (k) targeted region and (l) mismatch number with sgCTG. (m) Differential gene expression analysis in cortex of Htt.Q111 mice treated with AAV9-CBE + AAV9-GFP or AAV9-GFP vehicle at 12 weeks post-injection (RNA-seq). Each dot represents a transcript. Mean of four animals per group. r = 0.97 across 134,701 transcripts. (n) Whole-transcriptome C-to-U RNA off-target analysis in Htt.Q111 mice treated with AAV9-CBE + AAV9-GFP or AAV9-GFP vehicle. Mean ± SD of four animals. P = 0.0182, Welch’s two tailed t-test. All data points represent independent biological replicates. Source data
Extended Data Fig. 4
Extended Data Fig. 4. Adenine base editing of FXN GAA repeats in vitro.
(a) Cumulative % of interrupted FXN alleles with at least a specified number of A•T > G•C interruptions induced by GAA-ABE in FXN-mESCs and measured across 30 (FXN-30GAA-mES) and 50 (FXN-60GAA-mES) GAA repeats. Data are mean ± SD of biological triplicates. (b) Distribution of A•T > G•C interruptions throughout GAA repeats at interrupted FXN alleles in FXN-mES cells shown as % interrupted alleles with an A•T > G•C interruption at a given position in the GAA repeat tract. Data are mean ± SD of biological triplicates. (c) Composition of the A•T > G•C interruptions (GGG, GGA and GAG sequences) introduced at FXN alleles in HEK293T cells (9 GAAs) and FXN-mESCs (30 and 50 GAAs). Data are mean ± SD of biological triplicates. (d-e) CIRCLE-seq off-target hits in the mouse genome classified by (d) the number of mismatches with the sgGAA and (e) the identity of the targeted region annotated with HOMER. (f) Comparison of base editing frequencies quantified by WGS and amplicon sequencing (HTS) at selected sites. Each dot represents the average ratio of editing frequencies quantified by WGS and HTS at a single locus, obtained from biological triplicates. Data are plotted as log2 fold-change, with the median indicated by the horizontal line (n = 55). P < 0.0001, One sample t and Wilcoxon test. (g) CRISPRitz-predicted off-target sites in the macaque (Macaca mulatta) genome, categorized by mismatch position between the sgGAA and genomic site. Category A represents the five nucleotides proximal to PAM (positions 1-5), category B covers the next five nucleotides (positions 6-10), and category C includes the last ten, PAM-distal nucleotides (positions 11-20) of the protospacer. A0-A5, B0-B5 and C0-C10 denote the number of mismatches (0-5) between the sgGAA and a target site in each category. Each square shows the number of loci in each mismatch subgroup. Source data
Extended Data Fig. 5
Extended Data Fig. 5. Adenine base editing of FXN GAA repeats.
(a) CRISPRitz-predicted off-target sites in the human genome, categorized by mismatch position between the sgGAA and genomic site. Category A represents the five nucleotides proximal to PAM (positions 1-5), category B covers the next five nucleotides (positions 6-10), and category C spans the last ten, PAM-distal nucleotides (positions 11-20) of the protospacer. A0-A5, B0-B5 and C0-C10 denote the number of mismatches (0-5) between the sgGAA and a target site in each category. Each square shows the number of loci in each mismatch subgroup. (b) Predicted in cellulo base editing off-target activity of our ABE strategy in the macaque genome, based on in silico CRISPRitz predictions of off-target edits and a subsequent WGS-transformation using the ratio of off-targets edited in HEK293T ( > 0.5% editing by WGS) versus predicted by CRISPRitz in the human genome. Heatmap colors represent predicted in cellulo editing efficiency per mismatch bin, based on the corresponding editing frequencies per bin observed in WGS analysis of edited HEK293T cells. (c) Average number of A•T > G•C interruptions in edited FXN alleles isolated from control or FRDA patient-derived fibroblasts, directly observed or estimated. Data are mean ± SD of biological triplicates. ns – not significant, Welch’s two-tailed t-test. (d) Observed and estimated FXN GAA repeat editing in FRDA patient-derived fibroblasts (GM04078, 541/420 GAAs) 5-16 days and 1-3 cell passages (P) after electroporation, normalized to untreated controls. Data are mean ± SD of biological replicates (unrelated sgRNA n = 3, ABE-treated n = 5). (e) Composition of A•T > G•C interruptions (GGG, GGA and GAG sequences) introduced at FXN alleles in control (8/9 GAA repeats) or FRDA patient-derived fibroblasts (330/380 or 541/420 GAAs). Data are mean ± SD of biological triplicates. Source data
Extended Data Fig. 6
Extended Data Fig. 6. Adenine base editing of FXN GAA repeats in YG8s mice.
(a) Transduction efficiency in the cortex of YG8s mice treated with AAV9-GFP at 0.4-2.5×10¹⁰ vg/mouse. Mean ± SD (0.4 and 2.5×10¹⁰vg n = 5,1.5 ×1010vg n = 4). (b) FXN GAA repeat editing in heart, liver (Liv), striatum (Str), brainstem (Brst), and tail (T) of YG8s.300 mice treated with AAV9-ABEdCH at 24 weeks post-injection, observed by HTS or estimated, normalized to controls. Mean ± SD (heart and striatum n = 6, liver n = 12, brainstem n = 4, tail n = 3). (c) FXN GAA repeat editing in the cortex of YG8s GAA.300 mice treated with AAV9-ABEdCH at 4 and 24 weeks post-injection, observed by HTS or estimated, normalized to uninjected controls. Mean ± SD (4 weeks n = 4, 24 weeks n = 10). (d) Composition of A•T > G•C interruptions (GGG, GGA and GAG sequences) introduced at FXN alleles in 24-week-old YG8s mice treated with AAV9-ABEdCH. Mean ± SD (n = 6). (e) Average number of A•T > G•C interruptions in edited FXN alleles in 24-week-old YG8s mice as observed by HTS or estimated. Mean ± SD (YG8s.300 n = 6, YG8s.800 n = 5). (f) Average number of A•T > G•C interruptions in edited FXN alleles in 24-week-old YG8s.300 mice measured by nanopore sequencing. Mean ± SD (n = 6). (g) Cumulative probabilities of a given number of A•T > G•C interruptions in FXN alleles isolated from the cortex of YG8s.300 mice treated with AAV9-ABEdCH (n = 6) or uninjected controls (reference probability, mean of n = 2), determined by nanopore sequencing (Kolmogorov-Smirnov, p < 1.58−14. (h-i) Representative agarose gels used for quantification of GAA instability index in (h) YG8s.300 and (i) YG8s.800 mice treated with AAV9-ABEdCH (ABE), or controls (Ctrl); T- tail, Ctx – cortex. Each animal tissue was analyzed on the gel at least twice with similar results. (j) Expansion (IGAA(e), positive) and contraction (IGAA(c), negative) indices in tail and cortex of 24-week-old YG8s mice treated with AAV9-ABEdCH, or controls. Box plots of biological replicates (YG8s.300 n = 11, YG8s.800 n = 7). Median indicated with horizontal lines, whiskers show min-max values. *P = 0.0203, **P = 0.0022, ***P < 0.0003, Welch’s one-tailed t-test. All data points represent independent biological replicates. Source data

References

    1. Paulson, H. Repeat expansion diseases. Handb. Clin. Neurol.147, 105–123 (2018). - PMC - PubMed
    1. Halman, A., Dolzhenko, E. & Oshlack, A. STRipy: a graphical application for enhanced genotyping of pathogenic short tandem repeats in sequencing data. Hum. Mutat.43, 859–868 (2022). - PMC - PubMed
    1. Depienne, C. & Mandel, J. L. 30 years of repeat expansion disorders: what have we learned and what are the remaining challenges? Am. J. Hum. Genet.108, 764 (2021). - PMC - PubMed
    1. Cheng, Y., Zhang, S. & Shang, H. Latest advances on new promising molecular-based therapeutic approaches for Huntington’s disease. J. Transl. Int. Med.12, 134 (2024). - PMC - PubMed
    1. Ramakrishnan, S., Shah, M. & Gupta, V. Trinucleotid Repeat Disorders. In StatPearls [Internet] (StatPearls Publishing, updated 11 December 2024).