. 2025 May 26;15(1):18437.
doi: 10.1038/s41598-025-03661-w.

Characteristic gene expression profile of intestinal mucosa early in life promotes bacterial colonization leading to healthy development of the intestinal environment

Affiliations

Characteristic gene expression profile of intestinal mucosa early in life promotes bacterial colonization leading to healthy development of the intestinal environment

Yuu Nishinarita et al. Sci Rep. .

Abstract

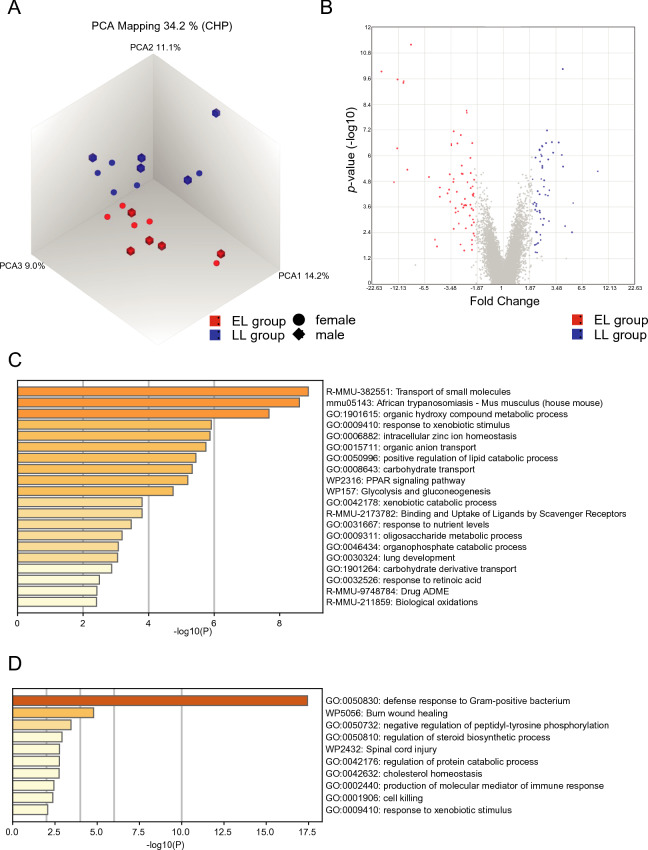
The gut microbiome early in life plays a crucial role in development of the host and affects health throughout life. The definition of a healthy microbiome early in life has not been established, and the underlying mechanism of how a young host selects appropriate microbes for colonization remains unclear. Understanding the mechanism may provide insights into novel preventive and therapeutic strategies by correcting dysbiosis early in life. We employed germ-free mice early in life (4 weeks of age) and later in life (10 weeks of age) for fecal microbiota transfer (FMT) from specific pathogen-free mice. We performed age-unmatched FMT between recipients early in life and donors early or later in life, in addition to common age-matched FMT. Age-matched FMT resulted in significantly different bacterial compositions between recipients early vs. later in life. When the gut microbiome from donors early or later in life was transferred to recipients early in life, bacterial compositions of recipients from donors later in life were similar to those of recipients from donors early in life. This finding suggests that the host early in life has mechanisms to select microbes appropriate for age from the exposed microbiome. We hypothesized that the age-specific intestinal environment promotes age-appropriate intestinal microbiome colonization and examined gene expression in the intestinal mucosa of germ-free mice. We observed that gene expression profiles were different between early vs. later in life. Correlation analysis demonstrated that genera Lachnospiraceae NK4A136 group and Roseburia were positively correlated to genes expressed predominantly early in life, but negatively with genes expressed predominantly later in life. We confirmed that the relative abundance of these genera was significantly higher in specific pathogen-free mice early in life compared with mice later in life. The characteristic gene expression of the intestinal mucosa early in life might play roles in selecting specific bacteria in the intestinal microbiome early in life.

Keywords: Aging; Bacterial colonization; Early life; Gut microbiome; Intestinal gene expression.


Conflict of interest statement

Declarations. Competing interests: The authors declare no competing interests.

Figures

Fig. 1
Fig. 1
Age and sex-matched gut microbiome transfer to germ-free mice early and later in life. (A) In cohort A, fecal samples were collected from specific pathogen-free (SPF) mice at 4 weeks of age (SPF A group), and fecal microbiota transfer (FMT) was performed in sex-matched germ-free (GF) mice at 4 weeks of age (ex-germ-free [exGF] A group). Age and sex-matched GF mice were used as controls (GF A group). In cohort B, fecal samples were collected from SPF mice at 10 weeks of age (SPF B group), and FMT was performed in sex-matched GF mice at 10 weeks of age (exGF B group). Age and sex-matched GF mice were used as controls (GF B group) (n = 5 per group). Fecal samples were collected at weeks 0, 2, and 4. Mice were sacrificed and tissues were collected at week 4. (B) Shannon diversity index of SPF A and SPF B groups at week 0. (C) Temporal changes in the bacterial compositions of cohorts A and B. Principal coordinate analysis plots based on unweighted and weighted UniFrac distances are shown for cohort A (SPF A and exGF A groups) and cohort B (SPF B and exGF B groups). (D) Shannon diversity index of exGF A and exGF B groups at weeks 2 and 4 after FMT. Data are described as the mean ± SEM (n = 5). *p < 0.05. Male data are shown in Fig. S1.
Fig. 2
Fig. 2
Subpopulations of CD4+ T cells in age-matched ex-germ-free recipients vs. specific pathogen-free donors. Flow cytometric analyses of CD4+ T cells expressing T-bet+, GATA3+, RORγt+, or Foxp3+ were performed in the spleen (A) and mesenteric lymph node (B) in cohorts A and B. Subpopulations of CD4+ T cells were compared between ex-germ-free (exGF) recipients vs. specific pathogen-free (SPF) donors. Data are described as the mean ± SEM (black filled circle: female [n = 5], black filled inverted triangle: male [n = 5]). *p < 0.05, **p < 0.01. The gating strategy for flow cytometric analyses is shown in Fig. S5.
Fig. 3
Fig. 3
Effect of age-unmatched gut microbiome transfer on bacterial compositions in young germ-free mice. (A) In cohort C, fecal samples were collected from specific pathogen-free (SPF) mice at 4 weeks of age (SPF C group), and fecal microbiota transfer (FMT) was performed in age and sex-matched germ-free (GF) mice at 4 weeks of age (ex-germ-free [exGF] C group). In cohort D, fecal samples were collected from SPF mice at 10 weeks of age (SPF D group), and FMT was performed in age-unmatched and sex-matched GF mice at 4 weeks of age (exGF D group) (n = 5 per group). Fecal samples were collected at week 0, 2, and 4. Mice were sacrificed and tissues were collected at week 4. (B) Shannon diversity index of SPF C and SPF D groups at week 0. (C) Temporal changes in the bacterial compositions of cohorts C and D. Principal coordinate analysis plots based on unweighted and weighted UniFrac distances are shown for cohort C (SPF C and exGF C groups) and cohort D (SPF D and exGF D groups). (D) Shannon diversity index of exGF C and exGF D groups at weeks 2 and 4 after FMT. Data are described as the mean ± SEM (n = 5). Male data are shown in Fig. S6.
Fig. 4
Fig. 4
Subpopulations of CD4+ T cells in young ex-germ-free recipients of age-unmatched fecal microbiota transfer. Flow cytometric analyses of CD4+ T cells expressing T-bet+, GATA3+, RORγt+, or Foxp3+ were performed in the spleen (A) and mesenteric lymph nodes (B) of ex-germ-free (exGF) C (fecal microbiota transfer [FMT] from young donors) and exGF D (FMT from adult donors) groups. Data are described as the mean ± SEM (black filled circle: female [n = 5], black filled inverted triangle: male [n = 5]). *p < 0.05, **p < 0.01. The gating strategy for flow cytometric analyses is shown in Fig. S5.
Fig. 5
Fig. 5
Ileal mucosal gene expression in germ-free mice early vs. later in life. (A) Principal component analysis plots of ileal mucosal gene expression profiles in germ-free (GF) mice at 4 weeks of age [early life (EL) group] and 10 weeks of age [later life (LL) group]. Red and blue dots represent EL and LL groups, respectively (n = 10 per group, black filled circle: female, black filled diamond: male). (B) Volcano plots of gene expression in the ileal mucosa of EL vs. LL groups. Red and blue dots indicate a gene that was expressed predominantly in EL or LL group, respectively (expression ratio > twofold and p < 0.05 between the two groups). A gray dot represents a gene that did not satisfy the criterion. (C) Characteristics annotated by enrichment analysis of genes predominantly expressed in the ileal mucosa in the EL group. (D) Characteristics annotated by enrichment analysis of genes predominantly expressed in the ileal mucosa in the LL group. Colon data are shown in Fig. S10.
Fig. 6
Fig. 6
Correlations between ileal gene expression and bacterial genera that colonized mice early in life. (A) Correlation analysis of gene expression in the ileal mucosa and bacterial amplicon sequencing variants (ASVs). In the heat map, each row represents a bacterial ASV derived from adult donors (1387 ASVs) and each column represents a gene that was expressed predominantly in the EL group (66 genes, red line) or LL group (54 genes, blue line). (B) Relative abundance of the genus Lachnospiraceae NK4A136 group in specific pathogen-free (SPF) mice at 4 vs. 10 weeks of age. (C) Relative abundance of the genus Roseburia in SPF mice at 4 vs. 10 weeks of age. (D) Total relative abundance of genera Lachnospiraceae NK4A136 group and Roseburia in SPF mice at 4 vs. 10 weeks of age. Data are described as the mean ± SEM (n = 10, black filled circle: female, black filled diamond: male). *p < 0.05, **p < 0.01. Colon data are shown in Fig. S11.

References

    1. Afzaal, M. et al. Human gut microbiota in health and disease: Unveiling the relationship. Front. Microbiol.13, 999001 (2022). - PMC - PubMed
    1. Chen, C. et al. Contribution of host genetics to the variation of microbial composition of cecum lumen and feces in pigs. Front. Microbiol.9, 2626 (2018). - PMC - PubMed
    1. Org, E. et al. Sex differences and hormonal effects on gut microbiota composition in mice. Gut Microbes.7(4), 313–322 (2016). - PMC - PubMed
    1. Bibbò, S. et al. The role of diet on gut microbiota composition. Eur. Rev. Med. Pharmacol. Sci.20(22), 4742–4749 (2016). - PubMed
    1. Vatanen, T. et al. Variation in microbiome LPS immunogenicity contributes to autoimmunity in humans. Cell165(4), 842–853 (2016). - PMC - PubMed

LinkOut - more resources