Case Reports
. 2025 Jun;6(6):1035-1055.
doi: 10.1038/s43018-025-00964-9. Epub 2025 May 26.

Cellular hierarchies of embryonal tumors with multilayered rosettes are shaped by oncogenic microRNAs and receptor-ligand interactions

Affiliations
Case Reports

Cellular hierarchies of embryonal tumors with multilayered rosettes are shaped by oncogenic microRNAs and receptor-ligand interactions

Alexander Beck et al. Nat Cancer. 2025 Jun.

Abstract

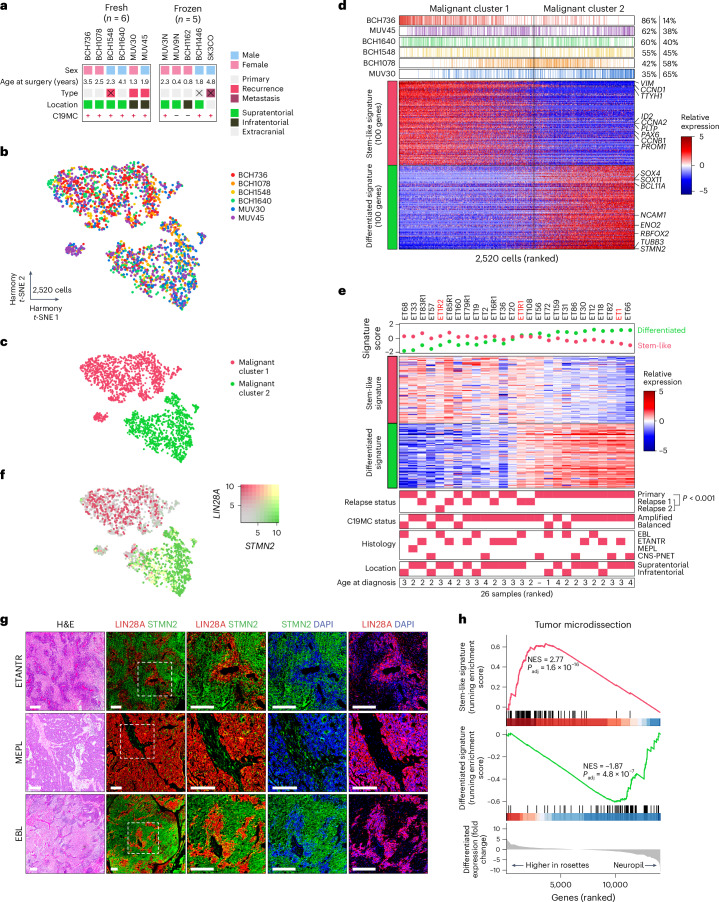
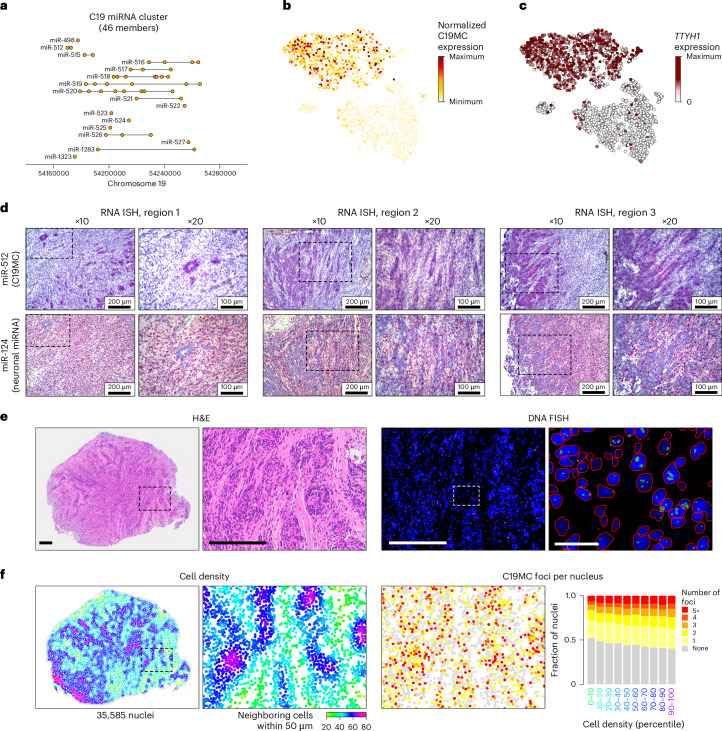
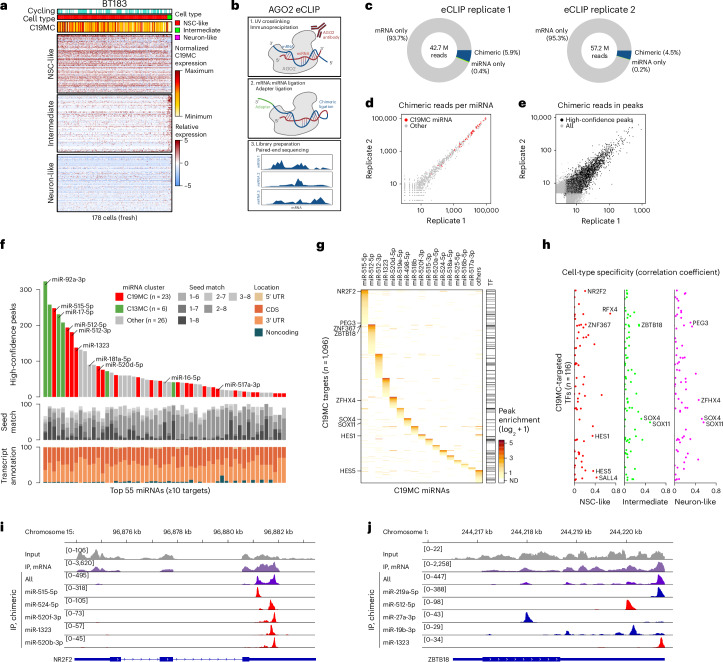
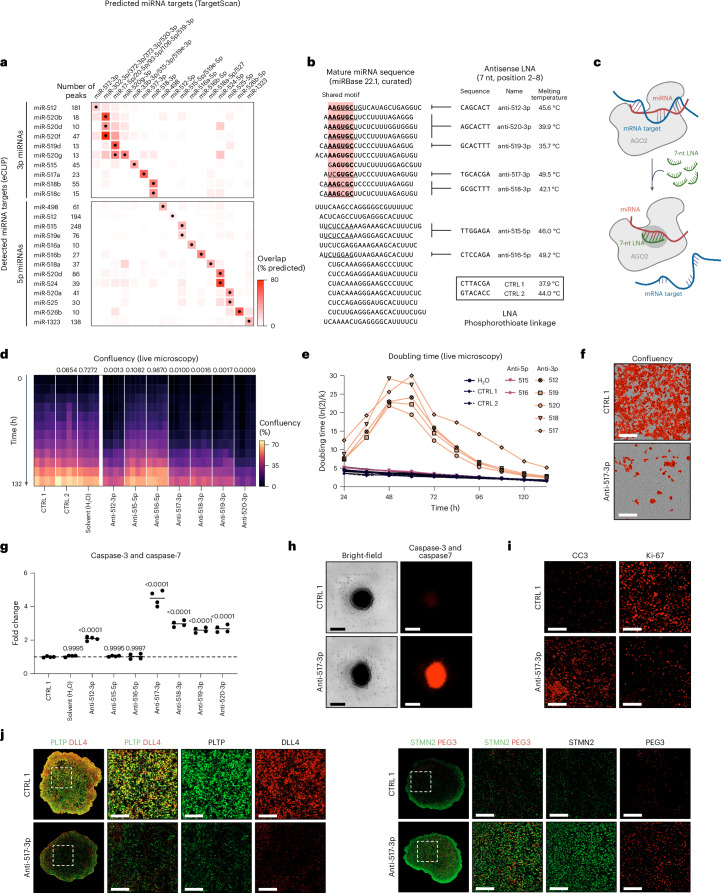
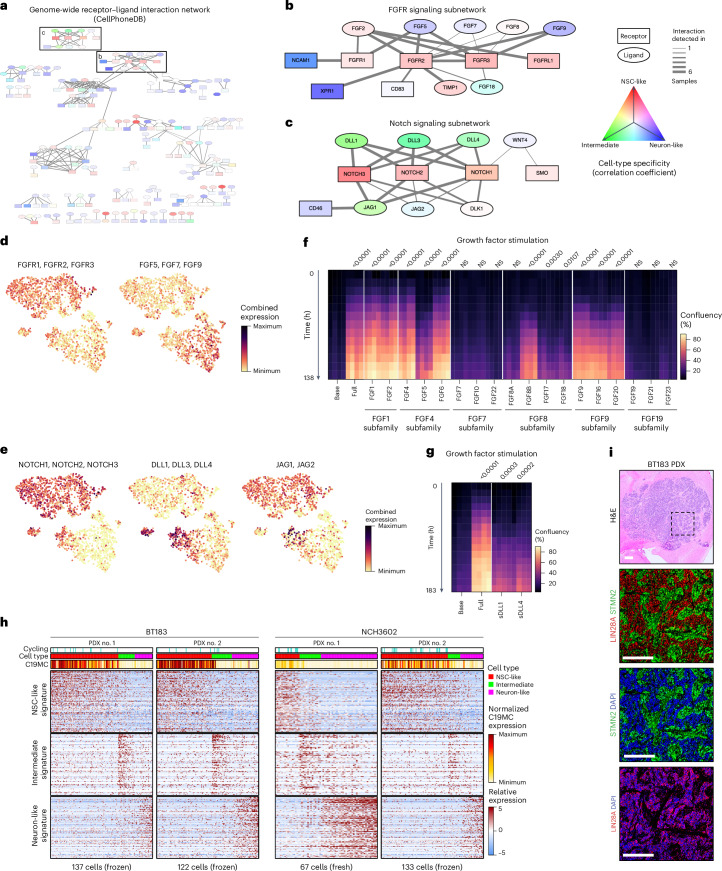
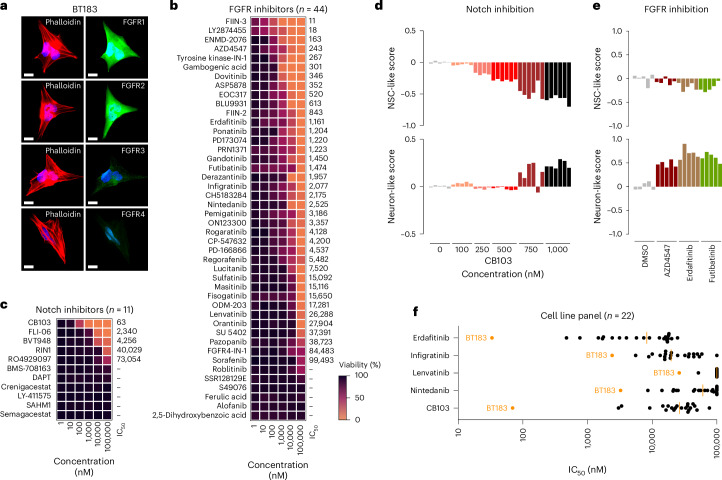
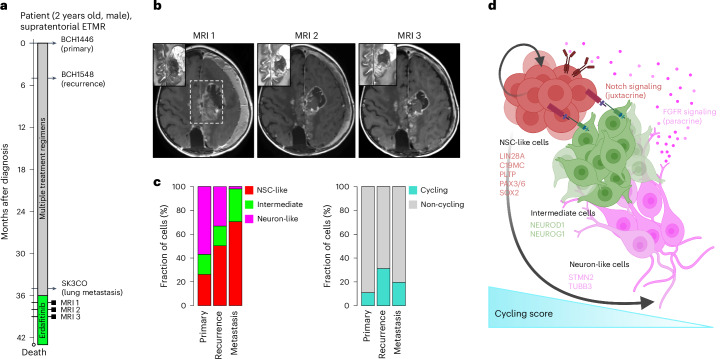
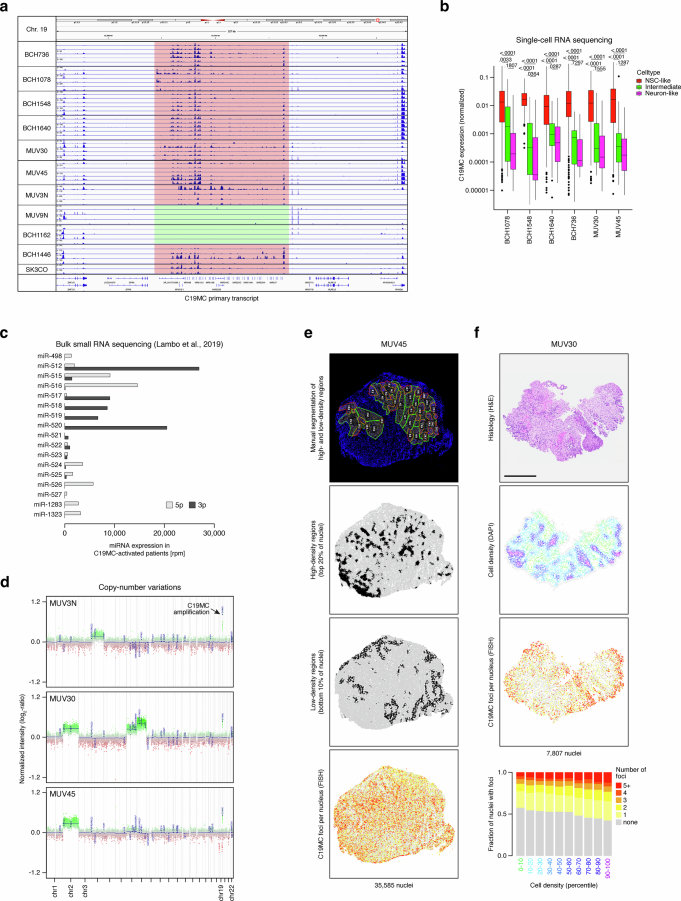
Embryonal tumor with multilayered rosettes (ETMR) is a pediatric brain tumor with dismal prognosis. Characteristic alterations of the chromosome 19 microRNA cluster (C19MC) are observed in most ETMR; however, the ramifications of C19MC activation and the complex cellular architecture of ETMR remain understudied. Here we analyze 11 ETMR samples from patients using single-cell transcriptomics and multiplexed spatial imaging. We reveal a spatially distinct cellular hierarchy that spans highly proliferative neural stem-like cells and more differentiated neuron-like cells. C19MC is predominantly expressed in stem-like cells and controls a transcriptional network governing stemness and lineage commitment, as resolved by genome-wide analysis of microRNA-mRNA binding. Systematic analysis of receptor-ligand interactions between malignant cell types reveals fibroblast growth factor receptor and Notch signaling as oncogenic pathways that can be successfully targeted in preclinical models and in one patient with ETMR. Our study provides fundamental insights into ETMR pathobiology and a powerful rationale for more effective targeted therapies.


Conflict of interest statement

Competing interests: M.G.F. is a consultant for Twentyeight-Seven Therapeutics and Blueprint Medicines. J.C.T. serves as a consultant for Advanced Accelerator Applications-Novartis. The other authors declare no competing interests.

Figures

Fig. 1
Fig. 1. scRNA-seq and multiplexed imaging of ETMR tumors.
a, Overview of clinical and molecular characteristics of the ETMR scRNA-seq cohort (n = 11 tumor samples). Sex, age at sample collection, tumor type, location and C19MC activation status are indicated. Samples indicated with X originated from the same patient at different disease stages. b, t-SNE visualization of high-quality malignant cells (n = 2,520 cells) from six samples of the fresh cohort, integrated using Harmony. Cells are colored according to the sample of origin. c, t-distributed stochastic neighbor embedding (t-SNE) visualization of n = 2,520 cells colored according to two major malignant cell clusters, identified using hierarchical clustering. d, Heatmap showing the relative expression of 100 genes specific to malignant clusters 1 (stem-like signature) and 2 (differentiated signature). Single cells (n = 2,520 cells) are ranked according to the difference in signature scores. The percentages of cells belonging to malignant clusters 1 and 2 are indicated above. Selected genes of interest are indicated on the right. e, Heatmap showing the relative expression of signature genes in n = 26 ETMR samples profiled using bulk expression arrays. Samples are ranked according to the difference in signature scores, shown above the heatmap. Red indicates the primary lesion (ET1) and two recurrences (ET1R1, ET1R2) collected from the same patient. Correlations to clinical and molecular annotations are indicated below the heatmap. Age at diagnosis is given in years. A two-sided Student’s t-test was used to determine the statistical significance between scores for malignant cluster 1 in primary and recurrent ETMR. PNET, primitive neuroectodermal tumor. f, t-SNE visualization of n = 2,520 cells colored according to the expression of the marker genes LIN28A (red) and STMN2 (green). g, Representative hematoxylin and eosin (H&E) and IF staining for LIN28A (red), STMN2 (green), and 4′,6-diamidino-2-phenylindole (DAPI) (blue) across the histological subtypes ETANTR, MEPL and EBL. Staining was performed on at least n = 3 different tumor samples for each subtype. EBL, ependymoblastoma; ETANTR, embryonal tumor with abundant neuropil and true rosettes; MEPL, medulloepithelioma. h, GSEA of malignant gene signatures in transcriptional profiles generated from microdissected rosette-like and neuropil-abundant tumor regions. NES, normalized enrichment score; Padj, adjusted P value. GSEA P values were calculated using a permutation test and adjusted for multiple comparisons using the Benjamini–Hochberg procedure. g, Scale bars, 300 µm. Source data
Fig. 2
Fig. 2. Transcriptional regulation of malignant cell-type transitions.
a, t-SNE visualization of n = 2,520 malignant ETMR cells colored for cells predicted as basal progenitor cells (green) using a random forest classifier trained on cells from the fetal neocortex. b, t-SNE visualization of n = 2,520 malignant ETMR cells, highlighting normalized expression of the basal progenitor cell marker genes ASCL1, INSM1, NHLH1 and NEUROD1. c, Heatmap showing normalized area under the curve (AUC) values (indicating regulon activity) from the SCENIC analysis. Four groups of regulons were formed by hierarchical clustering across patients. The annotation above the heatmap indicates the classification of n = 2,520 cells into three malignant cell types. d, Network showing similarity scores (thickness of connecting lines) determined using pairwise comparison of regulons shown in c. e, t-SNE visualization of n = 2,520 malignant ETMR cells colored according to refined cell types. f, t-SNE visualization of n = 2,520 malignant ETMR cells colored according to cell cycle state. g, t-SNE visualization of n = 2,520 malignant ETMR cells overlaid with differentiation trajectories generated by RNA velocity analysis of a representative ETMR sample (BCH736). h, Representative multiplexed IF images of n = 3 different primary ETMR samples for the marker TFs PAX6 (NSC-like cells, red), NEUROD1 (intermediate cells, green) and PEG3 (neuron-like cells, magenta; top). Magnification of the indicated region (dashed outline) in ETMR3 is shown as pairwise contrasts (bottom). i, Pseudo image (left) showing a reconstruction of cells analyzed using in silico phenotyping for the same region as in h, colored according to marker gene expression. The violin plots show the nearest neighbor distance analysis between different ETMR cell types identified using multiplexed phenotyping. A total of n = 46,621 cells were phenotyped. P values were calculated using a two-sided, unpaired Student’s t-test. The lines represent the mean values. h, Scale bars, 300 µm. Source data
Fig. 3
Fig. 3. Spatial analysis of C19MC expression across malignant cell types.
a, Schematic illustrating the genomic location of 46 miRNA members of C19MC, grouped into 17 miRNA families. b, t-SNE representation of n = 2,520 malignant ETMR cells highlighting the normalized expression of the C19MC pri-miRNA, as determined using scRNA-seq. c, t-SNE representation of n = 2,520 malignant ETMR cells colored for the relative expression of the C19MC fusion partner TTYH1. d, Microscopy images of RNA ISH analysis of the ETMR sample MUV3N stained for miR-512 (C19MC marker) and miR-124 (marker for neuron-like cells) on two consecutive tumor slices. Three tumor regions of the same slides are shown. The dashed outline indicates regions that are shown at higher magnification. Images show representative regions of one sample with a total of n = 3 patient tumors. e, Microscopy images of H&E (left) and DNA FISH (right) analysis of the C19MC-amplified sample MUV45 on consecutive tumor slices. The dashed outline indicates regions that are shown at higher magnification. The red and green boundaries in the rightmost image show automated segmentation of nuclei and subcellular C19MC foci, respectively. DNA FISH was performed and quantified on three individual ETMR samples. Images shown are representative of the three samples. f, Pseudo images showing systematic analysis of cell density and the number of distinct C19MC foci per nucleus derived from the DNA FISH images shown in e. A total of n = 35,585 nuclei were analyzed. The bar plot summarizes the numbers of C19MC foci per nucleus grouped according to cell density. e, Scale bars, 250 µm (H&E and DNA FISH, left) and 25 µm (DNA FISH, right). Source data
Fig. 4
Fig. 4. Genome-wide identification of miRNA targets using chimeric eCLIP.
a, Heatmap showing the relative expression of refined signature genes (n = 100 per signature) in n = 179 cells from the BT183 patient-derived in vitro model. Normalized expression levels of the pri-miRNA of C19MC and cell-type assignments are indicated above the heatmap. b, Schematic illustration of the AGO2 eCLIP experimental workflow. c, Pie charts showing the fractions of mRNA, miRNA and chimeric mRNA-miRNA in both eCLIP replicates (n = 42.7 M and 57.2 M reads). d, Scatter plot showing the number of chimeric reads per miRNA in both technical replicates. C19MC members are highlighted in red. e, Scatter plot showing the number of chimeric reads per peak in both technical replicates. High-confidence peaks are highlighted (n = 4,009). f, Top, Bar plot showing the number of high-confidence peaks for C19MC (red, n = 23 miRNAs), C13MC (green, n = 6 miRNAs) and other (gray, n = 26 miRNAs) miRNAs with at least ten target genes. Middle, Bar plot indicating the percentage of peaks containing the respective seed motifs. Bottom, Bar plot indicating the percentage of peaks in UTRs (5′ and 3′ UTRs), CDS or noncoding transcripts. g, Heatmap showing peak enrichment for high-confidence target genes (n = 1,096) of C19MC members. Target genes for miRNAs with fewer than 20 target genes are summarized in the rightmost column. TFs are highlighted next to the heatmap. Selected TFs are labeled on the left. h, Dot plots showing the correlation of C19MC-targeted TFs (n = 116) to cell-type-specific signature scores in single cells of the patient samples, in the same order as shown in g. Selected TFs are labeled. i, Genome plot of the region on chromosome 15, including the C19MC-targeted TF NR2F2. The track shows coverage in input control; the second track shows coverage of nonchimeric mRNA-only reads; the third track shows coverage of all chimeric reads, combined for all miRNAs; the remaining tracks show the chimeric reads associated with five separate C19MC members (shown in red). j, Genome plot of region on chromosome 1 encompassing the TF ZBTB18. Coverage tracks of chimeric reads associated with C19MC members miR-512-5p and miR-1323, and three non-C19MC miRNAs, are indicated in red and blue, respectively. Schematic in b created with BioRender.com. Source data
Fig. 5
Fig. 5. Targeting C19MC families with short antisense oligonucleotides.
a, Heatmap showing the overlap of C19MC targets detected in eCLIP with predicted targets from TargetScan. C19MC members are grouped into 3p (top, n = 10) and 5p (bottom, n = 13) miRNAs. The black dots indicate the largest overlap with predicted targets. The number of high-confidence peaks for each member are indicated. b, Mature C19MC miRNAs as in a. The AAGUGC seed motif in 3p miRNAs is highlighted in red. LNAs complemented the seed sequences of one or more C19MC members (7-nt-long, complementary to position 2–8). Nontargeting controls were designed (CTRL 1, CTRL 2). Predicted melting temperatures are indicated. c, Schematic illustration of the miRNA targeting mechanism of LNAs. d, Heatmap showing the confluency of BT183 ETMR cells treated with LNAs over time, tracked using live-cell microscopy in two-dimensional (2D) culture with four biological replicates. P values were calculated with a one-way analysis of variance (ANOVA) and adjusted P values are provided. The results of n = 4 biological replicates are shown. e, Longitudinal doubling time estimation for BT183 growth treated with the indicated LNAs. Doubling times were calculated using the log of exponential growth equation in Prism 8. The results of n = 4 independent experiments are shown. f, Bright-field images showing BT183 cell confluency after treatment with anti-517-3p or CTRL 1 LNAs for 72 h. Identified cell areas are highlighted in red. This experiment achieved reproducible results in four biological replicates. g, Dot plot showing the caspase-3 and caspase-7 signal after 72 h of LNA treatment in three-dimensional BT183 cells. The means are indicated. Statistical analysis was performed on n = 4 biological replicates using a one-way ANOVA, comparing each condition to CTRL 1. Padj values are given. h, Bright-field and fluorescence images showing the caspase-3 and caspase-7 signal after 72 h of treatment with anti-517-3p or CTRL 1 LNAs in BT183 cells. Images shown are representative of n = 4 biological replicates. i, IF image analysis of BT183 cells for Ki-67 and cleaved caspase-3 (CC3). Cells were treated with anti-517-3p or CTRL 1 LNAs for 72 h. This experiment achieved reproducible results in three biological replicates. j, Representative IF staining for the indicated markers. Cells were treated with anti-517-3p or CTRL 1 LNAs for 72 h. This experiment achieved reproducible results in three biological replicates. Left, The dashed boxes indicate the tumor area shown in the magnified panels on the right. f, Scale bars, 400 µm. h, Scale bars, 500 µm. i,j, Scale bars, 300 µm. Schematic in c created with BioRender.com. Source data
Fig. 6
Fig. 6. Systematic analysis of tumor-promoting receptor–ligand interactions.
a, Network graph showing the interactions between receptors (rectangles) and ligands (ellipses) across our single-cell ETMR cohort (n = 6 samples), as inferred using genome-wide CellPhoneDB analysis performed separately on each sample. The different fill colors indicate the cell-type specificity of receptors and ligands. Line width indicates the number of samples in which the interaction was detected (P < 0.05). A larger version of the network graph is shown in Extended Data Fig. 8a,b. b, The network graph shows the FGFR signaling subnetwork. Receptors are specifically expressed in NSC-like tumor cells, while several ligands are specific to neuron-like cells. Line width indicates the number of samples in which the interaction was detected (P < 0.05). c, Network graph showing the Notch signaling network. Receptors are specifically expressed in NSC-like tumor cells, while Delta ligands (DLL1, DLL3, DLL4) are specific to intermediate cells. d, t-SNE representation of n = 2,520 malignant ETMR cells colored according to the mean relative expression of FGF receptors (left) and ligands (right). e, t-SNE representation of n = 2,520 malignant ETMR cells colored according to the mean relative expression of Notch receptors (left), Delta ligands (center) and Jagged ligands (right). f, Heatmap showing cell confluency after FGF growth factor stimulation in BT183 ETMR cells over a time course of 138 h. Cells were seeded as 2D cultures and cell growth was followed by live-cell microscopy. Four biological replicates were analyzed and different FGF ligands were grouped according to subfamilies. Statistical analysis was performed using a one-way ANOVA of the AUCs. Padj values are given. The results of n = 4 biological replicates are shown. g, Heatmap showing cell confluency after soluble Delta ligand stimulation over a time course of 183 h. Four biological replicates were analyzed. Statistical analysis was performed using a one-way ANOVA of the AUCs. Padj values are given. The results of n = 4 biological replicates are shown. h, Heatmaps showing the relative expression of refined signature genes (n = 100) per ETMR cell type in n = 3 PDX models. Top, Cell-type assignment and cells in a cycling state are indicated. i, Representative H&E and IF staining of BT183 PDX for the indicated markers. Scale bars, 300 µm. This experiment achieved reproducible results in three biological replicates. The dashed box in the H&E image indicates the tumor area shown in the IF staining below. Source data
Fig. 7
Fig. 7. Small-molecule inhibitor screening uncovers promising drug candidates.
a, Images showing IF staining of BT183 cells for actin cytoskeleton (red) and four FGFRs (green). The images shown are representative of n = 3 biological replicates. Scale bars, 10 µm. b, Heatmap indicating the viability of BT183 cells screened for 44 FGFR inhibitors at different concentrations. Right, Half-maximal inhibitory concentration (IC50) values given in nanomolar concentrations. Inhibitors are sorted from top to bottom according to their respective IC50. The results of n = 4 biological replicates are shown. c, Heatmap indicating the viability of BT183 cells screened for 11 Notch inhibitors, sorted according to their respective IC50. The results of n = 4 biological replicates are shown. d, Bar plots showing NSC-like (top) or neuron-like (bottom) signature scores of BT183 cells treated with CB103 at the indicated concentrations for 7 days. The individual bars indicate technical replicates. This experiment was performed in n = 1 biological replicate. e, Bar plots showing the NSC-like (top) or neuron-like (bottom) signature scores of BT183 cells treated with 1,000 nM of the FGFR inhibitors AZD4547, erdafitinib and futibatinib for 3 days. The individual bars indicate technical replicates. This experiment was performed in n = 1 biological replicate. f, Dot plot showing the screening of five therapeutic drug candidates in a panel of 22 cancer cell lines. The ETMR cell line BT183 is highlighted in orange; the mean IC50 across the cell lines is indicated by the vertical bars. The results of n = 4 biological replicates for each cell line are shown. Source data
Fig. 8
Fig. 8. Partial response in one patient with ETMR upon erdafitinib treatment.
a, Schematic of the clinical history of n = 1 patient with ETMR. Therapeutic strategies, including surgeries (indicated by the arrows), chemotherapy and erdafitinib (the colored bars), and magnetic resonance tomographies (MRI) (indicated with squares) are depicted. Sample IDs are linked to the respective tumor lesions. b, Postcontrast axial T1 images of the brain with inset axial T2 images from the left paracentral lobule tumor site (dashed box) taken at monthly intervals: after 1.5 months of erdafitinib (left); after 2.5 months of erdafitnib (center); and after 3.5 months of erdafitinib and 1 month of talzoparib treatment (right). Note the resolution of measurable tumoral enhancement and marked reduction of T2 hypointense tumor by 2.5 months of erdafitinib (center). c, Bar plots indicating the proportions of malignant cell types (left) and cell cycle state (right) in n = 3 samples collected over the course of disease, analyzed using scRNA-seq. d, Graphical summary of cellular hierarchies identified in ETMR, and the proposed signaling interactions between different malignant cell types and potential targets for pharmacological intervention. Schematic in d created with BioRender.com. Source data
Extended Data Fig. 1
Extended Data Fig. 1. Sample genetics and single-cell quality control.
a) Flow cytometry plots exemplify the gating strategy for single cell sorting of fresh patient samples into 96-well plates. b) Table shows overview of mutations detected in DICER1 in the C19MC non-amplified samples BCH1162 and MUV9N by genome sequencing. IGV screenshot on the right shows that nearby mutations S1810Y and S1814L in sample MUV9N are not detected within the same sequencing read, indicating that two different alleles are affected. c) Dot plots show gene number per cell (left) and per percent mitochondrial reads (right). Samples are indicated by color. Cells that expressed less than 2,000 genes or more than 15% mitochondrial RNA, as indicated by dashed lines, were excluded from further analysis. A total of n = 2,571 high-quality cells were retained. d) Heatmaps show scRNA-seq derived copy-number variations in every cell (y axis) along the genome (x axis). One heatmap per sample is shown. n = 51 cells without discernible copy-number variations were labeled as non-malignant cells and excluded from further analysis. Related to Fig. 1. Source data
Extended Data Fig. 2
Extended Data Fig. 2. Cellular heterogeneity in the extended snRNA-sequenced ETMR sample cohort.
a) Heatmap shows copy number profiles derived from snRNAseq of cells from the frozen-sorted tumor samples (n = 886 cells) and non-malignant reference cells. b) tSNE representations of high-quality ETMR cells (n = 886 cells) from frozen-sorted tumor samples highlighting sample distribution (top) and malignant clusters (bottom). Gene signatures derived from fresh-sorted tumor samples were used to score and classify cells into malignant clusters 1 or 2. c) Heatmap shows the relative expression of 100 genes specific to malignant clusters 1 (stem-like signature) and 2 (differentiated signature) in frozen-sorted ETMR cells (n = 886 cells). Percentages of cells belonging to malignant clusters 1 and 2 are indicated above. Genes of interest are indicated on the right. d) tSNE representations of fresh-sorted ETMR cells (n = 2,520 cells), colored according to marker genes specific to malignant clusters 1 (stem-like signature: PLTP, PAX3) and 2 (differentiated signature: ENO2, TUBB3). e) Representative multiplex immunofluorescence images of ETMR tissue stained for markers for malignant clusters 1 (stem-like signature: PLTP, PAX3, LIN28A shown in red) and 2 (differentiated signature: NSE, TUBB3, STMN2 shown in green). DAPI staining was used to highlight the nuclei. Scale bars = 300 µm. This experiment achieved reproducible results in three biological replicates. Related to Fig. 1. Source data
Extended Data Fig. 3
Extended Data Fig. 3. Developmental correlates and transcriptional regulation of malignant cell types.
a) Heatmap shows relative expression levels of marker genes for malignant clusters 1 (stem-like signature) or 2 (differentiated signature) in fetal neocortex cells (n = 220 cells) 24. Samples were laser-microdissected and different germinal zones are annotated (top). Cell annotations for apical progenitor cells (AP1/2), basal progenitor cells (BP1/2), or mature neurons (N1/3) are indicated above the heatmap. b) tSNE visualization, colored by predictions from the random forest-based classifier for 7 (top) or 3 (middle) fetal neocortex cell types. Bottom row shows a ternary plot of random forest prediction scores of ETMR cells (n = 2,520 cells). Cells are colored according to their maximum prediction score for apical progenitors (brown), basal progenitors (green) or neurons (pink). Bar plot shows the fraction of cells classified as apical progenitors (brown), basal progenitors (green) or neurons (pink) per ETMR sample. c) Heatmap shows relative expression of neurodevelopmental TFs in fetal neocortex cells (n = 220 cells). Cell ordering is identical with panel (a). d) Heatmap shows relative expression levels of TFs associated with regulons derived from SCENIC analyses of the fresh-sorted ETMR scRNA-seq dataset (n = 2,520 cells). Four groups were shared across samples and five groups were not shared across samples. Annotations above the heatmap indicate classification of cells into malignant cell types. e) Heatmap shows pairwise similarity (Jaccard index) between target genes of regulons detected by SCENIC analysis (n = 55 regulons). f) Heatmap shows normalized Area Under the Curve (AUC) values of n = 2,520 cells (indicating regulon activation) derived from SCENIC analyses for five regulon groups that were not shared across samples. Related to Fig. 2. Source data
Extended Data Fig. 4
Extended Data Fig. 4. Gene signatures of malignant cell types.
a) Sankey plot (left) shows the distribution and relationship of n = 2,520 cells assigned to malignant clusters 1 and 2 versus NSC-like, intermediate, and neuron-like clusters. NSC-like and neuron-like cells almost entirely derive from malignant clusters 1 and 2, respectively. The intermediate population derives from both malignant clusters. Bar plot (right) shows the fractions of malignant cell types per fresh-sorted ETMR sample. b) Heatmap shows relative expression of signature genes specific to cycling, NSC-like, intermediate, and neuron-like cells in the fresh-sorted ETMR scRNAseq dataset (n = 2,520 cells). Sample annotation, cycling cells, and cell type assignment are indicated on top of the heatmap. Genes of interest are highlighted on the right. c) Proportional venn diagrams highlight the overlap of genes associated with different single cell-derived signatures. d) Sankey plot (left) shows the distribution and relationship between n = 2,520 cells assigned to the NSC-like, intermediate, and neuron-like clusters versus the cell cycle state. Bar plot (right) shows the fractions of cycling and non-cycling cells per fresh-sorted ETMR sample. e) tSNE visualization of the fresh-sorted ETMR scRNAseq dataset (n = 2,520 cells), overlaid with differentiation trajectories defined by RNA velocity analysis. f) Images show representative multiplexed immunofluorescence stainings of three primary ETMR samples for PAX6 (NSC-like cells, red), NEUROD1 (Intermediate cells, green) and PEG3 (neuron-like cells, magenta) TFs. Scale bars = 500 µm. This experiment was performed at least three times for each tumor sample. g) Pseudo images of in silico phenotyped cells of the images shown in panel (f). Coordinates and phenotypes of cells were determined as described in the methods. Pseudo images are resolved by marker genes PAX6 (NSC-like cells, red), NEUROD1 (Intermediate cells, green) and PEG3 (neuron-like cells, magenta). This experiment was performed at least three times for each tumor sample. Related to Fig. 2. Source data
Extended Data Fig. 5
Extended Data Fig. 5. Expression of C19MC in patient samples.
a) Genome plot showing combined scRNA-seq coverage of a 330 kb region encompassing the C19MC locus for each ETMR sample, grouped by plate. Approximate boundaries of the C19MC primary transcript are highlighted in red (C19MC activated samples, n = 9) and green (non-C19MC activated samples, n = 2). b) Boxplot showing normalized expression levels of the C19MC primary transcript (pri-miRNA) per cell (n = 2,520 cells) in a cell type- and sample-resolved manner, as quantified by scRNA-seq. Cell numbers per cell type and sample are given in Supplementary Table 2c. Boxes indicate the median and the lower and upper hinges of the boxes correspond to the first and third quartiles. Outliers are indicated by individual dots outside of the whiskers. P values upon two-sided student’s t-tests are given. n.s. Not significant. c) Bar plot shows average expression levels of C19MC members in C19MC-amplified ETMR, assessed by small RNA sequencing of bulk tumor samples (n = 7). Expression levels of the mature 5p and 3p miRNAs arms are shown. d) Copy-number variation profile of three ETMR tumor samples that were analyzed by RNA in-situ hybridization (RNA-ISH) or DNA fluorescence in-situ hybridization (DNA-FISH). Genomic location of the C19MC amplification is indicated. e) Additional images of DNA-FISH analysis of sample MUV45. Top panel shows manual segmentation of rosette-like structures (red boundaries) and neuropil-abundant areas (green boundaries). Second and third panels indicate nuclei in high- and low-density regions, respectively (black). Bottom panel indicates the number of distinct C19MC foci per nucleus. f) Microscopy images of H&E (top panel) and DNA fluorescence in situ hybridization (DNA-FISH, other panels) analysis of C19MC-amplified sample MUV30 on consecutive tumor slices. Pseudo images show systematic analysis of cell density and number of distinct C19MC per nucleus. Bar plot summarizes the numbers of distinct C19MC foci per nucleus grouped according to cell density. DNA-FISH was performed and quantified on three individual ETMR samples. Scale bars = 500 µm. Related to Fig. 3. Source data
Extended Data Fig. 6
Extended Data Fig. 6. Identification of miRNA-mRNA interactions using eCLIP.
a) Dot plot shows expression of mature miRNAs in BT183 cell line assessed by small-RNA sequencing. Detected C19MC members are colored in red (n = 67). Most highly expressed miRNAs of interest are highlighted. b) Histograms show the number of detected reads as a function of paired-end read length for replicate 1 and 2 of the eClip experiment in BT183 cells. Only reads that contain a mature miRNA sequence at the 5′ end (miRNA-only and chimeric reads) are shown. Percentages of reads for each population relative to all reads (chimeric and non-chimeric) are indicated. Over 5 million chimeric reads were detected across replicates. c) Dot plot shows the enrichment of chimeric reads in detected peaks over normalized reads in the input control, combining both replicates. n = 4,009 high-confidence peaks are indicated in black. d) Heatmap shows overlap (Jaccard index) in genes targeted by individual C19MC members. The total number of target genes per C19MC member is indicated in the bar plot on the left, split by genes that are targeted by a single or multiple members. miRNAs of interest are highlighted by arrows. e) Genome plot of region on chromosome 9 encompassing the 3′ UTR of TF transcription factor ZNF367. Top track shows coverage in input control, second track shows coverage of non-chimeric mRNA-only reads. Third track shows coverage of all chimeric reads, combined for all miRNAs. Remaining tracks show coverage of chimeric reads associated with C19MC members miR-512-5p and miR-515-5p and three non-C19MC miRNAs, indicated in red and blue, respectively. f) Genome plot of region on chromosome 5 encompassing EGR1, similar to panel (e). g) Genome plot of region on chromosome 6 encompassing SOX4, similar to (e). h) Genome plot of region on chromosome 2 encompassing SOX11, similar to (e). i) Genome plot of region on chromosome 3 encompassing HES1, similar to (e). j) Genome plot of region on chromosome 1 encompassing HES5, similar to (e). Related to Fig. 4. Source data
Extended Data Fig. 7
Extended Data Fig. 7. Functional analyses of C19MC in cell line models.
a) Scatter plot shows a re-analysis of the dataset published by Mong et al., 2020. C19MC is expressed in HEK293 cells using a CRISPR activation system and two different gRNAs specific for its promoter region. Downregulated genes (n = 509, putative C19MC targets) are located at the bottom left. C19MC targets identified by eCLIP in BT183 cells are indicated in red. Scatter plot at the bottom shows a magnified view of downregulated genes, with key C19MC targets labeled. b) Heatmap on the left shows relative gene expression of 75 downregulated genes that were also identified as C19MC targets by eCLIP. Heatmap on the right shows a detailed view for which C19MC member eCLIP peaks were detected. c) Brightfield images showing BT183 ETMR cell confluency after treatment for 72 h with LNAs targeting seven C19MC families, non-targeting CTRL-LNAs (CTRL1, CTRL2), or solvent control (H2O). Identified cell areas are highlighted in red. Scale bars = 400 µm. Images shown are representative of the n = 4 biological replicates. d) Brightfield and fluorescence images showing BT183 cell caspase 3/7 signal after treatment for 72 h with LNAs targeting seven C19MC families, non-targeting CTRL-LNAs (CTRL1, CTRL2), or Solvent control (H2O). Scale bars = 500 µm. Images shown are representative of the n = 4 biological replicates. e) Bar plots show quantification of protein expressing cells for the indicated markers assessed by immunofluorescence analysis. Percentages of positive cells from three replicates are shown as mean values with SEM. P-values were calculated using the two-sided, unpaired Student’s t-test. Related to Figs. 4 and 5. Source data
Extended Data Fig. 8
Extended Data Fig. 8. CellPhoneDB analysis reveals receptor-ligand interactions.
a) Network graph of CellPhoneDB analysis shows inferred ligand (ellipses) and receptor (rectangles) interactions in our single-cell dataset (P < 0.05, n = 6 samples). Colors indicate correlation of expression levels to cell type-specific signature scores. CellPhoneDB analysis was performed on each sample separately. The width of edges indicates the number of samples the interaction was detected in. b) Bar plot shows the number of cells detected per malignant cell type across fresh-sorted ETMR samples. c) Bar plot shows average expression of FGFR genes in single cell data of fresh-sorted ETMR samples, separated by malignant cell type. Average expression in the BT183 cell line is indicated on the right. d) Bar plot shows expression of FGF ligands. e) Bar plot shows expression of NOTCH receptors. f) Bar plot shows expression of Delta ligands. For barplots shown in panels (b-f) n = 2,520 cells from tissue samples and n = 179 cells from BT183 were plotted. Related to Fig. 6. Source data
Extended Data Fig. 9
Extended Data Fig. 9. FGFR and Notch inhibition in ETMR cells.
a) Bar plots show quantification of fluorescent signals for four FGF receptors in BT183 cells. Signals from over 12,000 cells were analyzed and normalized to the cell area determined by Phalloidin. Percentages of positive areas for FGFR1, 2, 3 and 4 are shown as mean values with SEM. b) Bar plots showing intermediate (top) and cycling (bottom) signature scores in BT183 cells that were treated with CB103 at the indicated concentrations for 7 days. Individual bars for each indicate technical replicates. This experiment was performed in one biological replicate. c) Boxplot shows C19MC expression levels in BT183 cells upon treatment with different concentrations of the NOTCH inhibitor CB103 or DMSO control. Two-sided student’s t-tests were performed. P values are indicated. Each box represents the median +/− interquartile range of n = 4–6 wells as in b) treated with the inhibitor at indicated concentrations. d) Boxplot shows expression of TTYH1, the presumed fusion partner of C19MC upon treatment as in (c). Two-sided student’s t-tests were performed. P values are indicated. Each box represents the median +/− interquartile range of n = 4–6 wells as in b) treated with the inhibitor at indicated concentrations. e) Bar plots show intermediate (top) and cycling (bottom) signature scores in BT183 cells treated with 1000 nM of the FGFR inhibitors AZD4547, erdafitinib, or futibatinib for 3 days. This experiment was performed in one biological replicate. f) Boxplot shows C19MC expression levels after 3 days of treatment with three different FGFR inhibitors (1,000 nM) or DMSO control. Two-sided student’s t-tests were performed. P values are indicated. Each box represents the median +/− interquartile range of n = 5 wells treated with the inhibitor at indicated concentrations. g) Boxplot as in (f) after 7 days of treatment. Two-sided student’s t-tests were performed. P values are indicated. Each box represents the median +/− interquartile range of n = 5 wells treated with the inhibitor at indicated concentrations. h) Gene set enrichment analysis plot of the KEGG Notch signaling pathway gene set in transcriptional profiles generated from AZD4547-treated BT183 ETMR cells versus DMSO controls. NES Normalized enrichment score, p.adj adjusted P-value. i) Gene set enrichment analysis plot for cells treated with erdafitinib. j) Gene set enrichment analysis plot for cells treated with futibatinib. Related to Fig. 7. Source data
Extended Data Fig. 10
Extended Data Fig. 10. Clinical translation of a previously unreported drug candidate and longitudinal tumor profiling.
a) Illustration of clinical history of an ETMR patient treated with erdafitinib on a compassionate use basis. Therapeutic interventions (radiation, chemo-/targeted therapy, surgical resections) as well as radiological examinations are indicated by symbols and colors. Sample IDs are linked to the respective tumor lesions. CSI = Craniospinal Irradiation; DFMO = Difluoromethylornithine; GTR = Gross Total Resection; IND = Investigational New Drug; MRI = Magnetic Resonance Imaging; RT = Radiotherapy; b) Bar plots show the NSC-like signature score in cells from the primary tumor (BCH1446, n = 172 cells, top row), the recurrent lesion (BCH1548, n = 324 cells, middle row), as well as the metastatic tumor (SK3CO, n = 153 cells, bottom row). Bars are colored by cell type (left column), TTYH1 expression (middle column), and C19MC pri-miRNA expression (right column). c) Bar plot shows the expression of FGFR genes in longitudinal samples from the same patient, separated by malignant cell types. The primary tumor (BCH1446, n = 172 cells, top row), the recurrent lesion (BCH1548, n = 324 cells, middle row), as well as the metastatic tumor (SK3CO, n = 153 cells, bottom row) were analyzed. d) Bar plot shows the expression FGF ligands. The primary tumor (BCH1446, n = 172 cells, top row), the recurrent lesion (BCH1548, n = 324 cells, middle row), as well as the metastatic tumor (SK3CO, n = 153 cells, bottom row) were analyzed. e) Scatter plot shows comparison of average gene expression profiles from different samples of the same patient (primary tumor and lung metastasis). Only NSC-like cells were used (n = 153 cells). f) Heatmap shows the top 50 up- and downregulated genes between both samples. Columns represent individual NSC-like cells (n = 45 and n = 108 cells). Genes of interest are indicated on the right. Genes encoding for ribosomal proteins are indicated by dots. Related to Fig. 8. Source data

References

    1. Lambo, S., von Hoff, K., Korshunov, A., Pfister, S. M. & Kool, M. ETMR: a tumor entity in its infancy. Acta Neuropathol.140, 249–266 (2020). - PMC - PubMed
    1. Khan, S. et al. Clinical phenotypes and prognostic features of embryonal tumours with multi-layered rosettes: a Rare Brain Tumor Registry study. Lancet Child Adolesc. Health5, 800–813 (2021). - PubMed
    1. von Hoff, K. et al. Therapeutic implications of improved molecular diagnostics for rare CNS embryonal tumor entities: results of an international, retrospective study. Neuro Oncol.23, 1597–1611 (2021). - PMC - PubMed
    1. Korshunov, A. et al. Embryonal tumor with abundant neuropil and true rosettes (ETANTR), ependymoblastoma, and medulloepithelioma share molecular similarity and comprise a single clinicopathological entity. Acta Neuropathol.128, 279–289 (2014). - PMC - PubMed
    1. Neumann, J. E. et al. A mouse model for embryonal tumors with multilayered rosettes uncovers the therapeutic potential of Sonic-hedgehog inhibitors. Nat. Med.23, 1191–1202 (2017). - PubMed

Publication types

MeSH terms

LinkOut - more resources