. 2025 May 26;16(1):4875.
doi: 10.1038/s41467-025-60207-4.

Structural basis of ubiquitin ligase Nedd4-2 autoinhibition and regulation by calcium and 14-3-3 proteins

Affiliations

Structural basis of ubiquitin ligase Nedd4-2 autoinhibition and regulation by calcium and 14-3-3 proteins

Masa Janosev et al. Nat Commun. .

Abstract

Nedd4-2 E3 ligase regulates Na+ homeostasis by ubiquitinating various channels and membrane transporters, including the epithelial sodium channel ENaC. In turn, Nedd4-2 dysregulation leads to various conditions, including electrolytic imbalance, respiratory distress, hypertension, and kidney diseases. However, Nedd4-2 regulation remains mostly unclear. The present study aims at elucidating Nedd4-2 regulation by structurally characterizing Nedd4-2 and its complexes using several biophysical techniques. Our cryo-EM reconstruction shows that the C2 domain blocks the E2-binding surface of the HECT domain. This blockage, ubiquitin-binding exosite masking by the WW1 domain, catalytic C922 blockage and HECT domain stabilization provide the structural basis for Nedd4-2 autoinhibition. Furthermore, Ca2+-dependent C2 membrane binding disrupts C2/HECT interactions, but not Ca2+ alone, whereas 14-3-3 protein binds to a flexible region of Nedd4-2 containing the WW2 and WW3 domains, thereby inhibiting its catalytic activity and membrane binding. Overall, our data provide key mechanistic insights into Nedd4-2 regulation toward fostering the development of strategies targeting Nedd4-2 function.


Conflict of interest statement

Competing interests: The authors declare no competing interests.

Figures
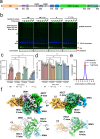
Fig. 1
Fig. 1. Characterization of full-length Nedd4-2 in solution.
a Schematic representation of the domain structure of Nedd4-2 isoform 5. C2, calcium binding domain (peach); WW1 (pale purple); L region (gray); WW2 (pale blue); WW3 (cornflower blue); WW4 (blue); HECT N-lobe, N-lobe of the catalytic HECT domain (light green); HECT C-lobe, C-lobe of the catalytic HECT domain (forest green). Red lines denote the phosphorylation sites/14-3-3-binding motifs S342 and S428. b Analysis of Nedd4-2-mediated ubiquitination of the chloride channel ClC-5 under four experimental conditions: NP unphosphorylated, P phosphorylated, and with or without 1 mM CaCl₂. Proteins were separated on a 4–15% SDS-PAGE polyacrylamide gradient gel and visualized by in-gel fluorescent imaging: fluorescein-labeled ubiquitin (green, 473 nm) and AF633-labeled ClC-5 (blue, 633 nm). A Coomassie blue-stained gel showing the unmodified Nedd4-2 is shown below. c Quantification of ubiquitinated products by in-gel fluorescent imaging at 473 nm (arb. units arbitrary units). d Quantification of unmodified Nedd4-2 from Coomassie blue-stained SDS-PAGE gels. The intensities at each time point (c, d) were normalized to the intensity at time zero. Data represent mean ± SD from three independent experiments. Statistical significance was determined using an unpaired two-tailed Student’s t-test (ns non-significant p > 0.05). e Area-normalized distribution of sedimentation coefficients (c(s)) of unphosphorylated Nedd4-2 in a buffer with (red) and without (blue) 1 mM CaCl2. f Cryo-EM density map generated using threshold level 7 with a cartoon representation of the Nedd4-2 model, L(α1), α1 helix in the L region. Source data are provided as a Source Data file.
Fig. 2
Fig. 2. Cryo-EM structure of full-length Nedd4-2.
a Cartoon representation of the Nedd4-2 model from cryo-EM reconstruction with close-up views of the interface regions between C2 (in peach), WW1 (in pale purple), WW4 (in blue), and HECT (in green) domains. Sidechains of important residues are indicated in sticks and labeled. Teal dashed lines indicate atom-atom distances within H-bonding range. Position of the α1 helix in the L region. Re site and Le site are marked in the figure. Mutated residues are labeled in red. b Autoubiquitination assay of Nedd4-2 and its mutant variants on the interfaces of individual domains. Proteins were separated on a 4–15% polyacrylamide gradient gel using SDS-PAGE. WT wild-type, M1–M4 the mutant variants. Unmodified Nedd4-2 was quantified and normalized to the zero time point. Data represent mean ± SD from three independent experiments. Statistical significance was determined using an unpaired two-tailed Student’s t-test (ns non-significant p > 0.05; *p ≤ 0.05; **p ≤ 0.01; ***p ≤ 0.001; ****p ≤ 0.0001). Source data are provided as a Source Data file.
Fig. 3
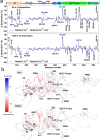
Fig. 3. Calcium does not induce large conformational changes in Nedd4-2.
a Differential effects of calcium on deuterium uptake of Nedd4-2 after 20 and 1200 s of deuteration. The plotted data represent the difference in deuteration with and without 1 mM Ca2+. Negative values depict Nedd4-2 regions with increased deuterium uptake (deprotection) without Ca2+. Light red shade indicates mean ± SD of three technical replicates. Breaks within plots result from missing data (regions without coverage). Significant changes are marked with residue numbers. The domain structure of Nedd4-2 is shown at the top. C2 calcium binding domain, WW1-4 WW domains, L L region, HECT N-lobe N-lobe of the catalytic HECT domain, HECT C-lobe C-lobe of the catalytic HECT domain. b HDX-MS differences mapped on the SAXS-based model of full-length Nedd4-2. Deprotected and protected regions are indicated in red and blue, respectively, in the presence of Ca2+. Source data are provided as a Source Data file.
Fig. 4
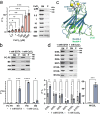
Fig. 4. Nedd4-2 binds to the lipid membrane via the N-terminal C2 domain in a Ca2+-dependent manner.
a Nedd4-2 binding to BE-based LUVs with different concentrations of Ca2+. b Nedd4-2 binding to LUVs with different compositions. SN, supernatant; P, pellet (lipid-bound fraction); PC:PE, in 80:20 ratio; BE, Brain Polar Extract; PM, plasma-mimicking membrane; NM, nuclear-mimicking membrane. c Comparison of the crystal structure of the Nedd4-1 C2 domain bound to Ca2+ (PDB: 3B7Y) with the crystal structure of the Nedd4-2 C2 domain without Ca2+ (PDB: 2NSQ). The residues involved in calcium binding are labeled and shown as sticks. The position of the residue L122 of Nedd4-1, corresponding to M122 in Nedd4-2, which was used as a negative control (Nedd4-2 M122L mutation), is labeled and highlighted in green (primary sequence alignment of these domains is shown in Supplementary Fig. 15a). d Mutant Nedd4-2 binding to BE-based LUVs with and without 1 mM Ca2+. Quantified data (a, b, d) are expressed as means ± SD of three independent experiments. Statistical significance was determined using an unpaired two-tailed Student’s t-test (ns, non-significant p > 0.05; *p ≤ 0.05; **p ≤ 0.01; ***p ≤ 0.001; ****p ≤ 0.0001). P% represents the percentage of protein in the pellet relative to the sum of densities of both supernatant and pellet fractions (P/(SN + P)). Source data are provided as a Source Data file.
Fig. 5
Fig. 5. Nedd4-2 undergoes structural reorganization upon membrane binding.
a Differential effects of LUVs on deuterium uptake of Nedd4-2 with 1 mM Ca2+ after 20 and 1200 s of deuteration. The plotted data represent the difference in deuteration with and without BE-based LUVs. Positive and negative values indicate Nedd4-2 regions with decreased (protection) and increased (deprotection) deuterium uptake in the presence of LUVs, respectively. Light blue shade indicates mean ± SD of three technical replicates. Breaks in plots result from missing data (regions without coverage). Nedd4-2 segments with significant changes are marked with residue numbers. The domain structure of Nedd4-2 is shown at the top. C2 calcium binding domain, WW1-4 WW domains, HECT N-lobe N-lobe of the catalytic HECT domain, HECT C-lobe C-lobe of the catalytic HECT domain. b HDX-MS differences mapped on a SAXS-based model of full-length Nedd4-2. Deprotected and protected regions in the presence of LUVs are indicated in red and blue, respectively. Source data are provided as a Source Data file.
Fig. 6
Fig. 6. 14-3-3 protein blocks Nedd4-2 membrane binding and catalytic activity.
a, b Series of area-normalized sedimentation coefficient distributions c(s) of Nedd4-2 and 14-3-3η mixtures at various molar ratios, using 0.5 μM Nedd4-2 and 0.1–10 μM 14-3-3η. The binding curve of weight-average sedimentation coefficients sw was calculated from SV-AUC experiments with 14-3-3η and Nedd4-2 mixtures in buffer containing 1 mM EDTA (a) or 1 mM Ca2+ (b). c Autoubiquitination reaction results after 60 min of incubation without 14-3-3η (-) and with a 2× or 5× molar excess of 14-3-3η. Ubiquitinated products were visualized and quantified by in-gel fluorescent imaging using fluorescein-labeled ubiquitin (green, excitation at 473 nm). Intensities were normalized to the sample without 14-3-3η. d Quantification of unmodified Nedd4-2 after a 60-min autoubiquitination reaction was performed without 14-3-3η (-) and with a 2× or 5× molar excess of 14-3-3η. Unmodified Nedd4-2 was quantified from Coomassie blue-stained SDS-PAGE gels and normalized to the reaction lacking 14-3-3η. e Nedd4-2 binding to BE-based LUVs with 1 mM Ca2+ and various molar excesses of 14-3-3η. P%, percentage of protein in the pellet, relative to the sum of densities of both supernatant and pellet fractions (P/(SN + P)). Quantified data (ce) are expressed as means ± SD of three independent experiments. Statistical significance was determined using an unpaired two-tailed Student’s t-test (ns, non-significant p > 0.05; *p ≤ 0.05; **p ≤ 0.01; ***p ≤ 0.001). Source data are provided as a Source Data file.
Fig. 7
Fig. 7. Model of Nedd4-2 regulation by autoinhibition, 14-3-3 protein, and calcium ions binding.
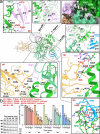
In the inactive state, Nedd4-2 is autoinhibited by a “multi-lock” mechanism whereby the L region restricts HECT flexibility, the C2 and WW1 domains mask Ub- (re site) and E2-binding surfaces, while WW4 masks the region containing the autoubiquitination site K580 (Le site). Phosphorylation-dependent 14-3-3 protein binding to motifs adjacent to the WW2 domain blocks the WW2 and WW3 domains, thereby inhibiting Nedd4-2 membrane association and enzymatic activity. Ca2+-dependent membrane binding, substrate binding (via the WW domains), and dephosphorylation of 14-3-3 binding motifs release inhibitory intra- and intermolecular interactions. Schematic illustration was created in Inkscape v1.3.

References

    1. Popovic, D., Vucic, D. & Dikic, I. Ubiquitination in disease pathogenesis and treatment. Nat. Med.20, 1242–1253 (2014). - PubMed
    1. Foot, N., Henshall, T. & Kumar, S. Ubiquitination and the regulation of membrane proteins. Physiol. Rev.97, 253–281 (2017). - PubMed
    1. Rotin, D. & Kumar, S. Physiological functions of the HECT family of ubiquitin ligases. Nat. Rev. Mol. Cell Biol.10, 398–409 (2009). - PubMed
    1. Li, W. et al. Genome-wide and functional annotation of human E3 ubiquitin ligases identifies MULAN, a mitochondrial E3 that regulates the organelle’s dynamics and signaling. PLoS ONE3, e1487 (2008). - PMC - PubMed
    1. Zheng, N. & Shabek, N. Ubiquitin ligases: structure, function, and regulation. Annu. Rev. Biochem.86, 129–157 (2017). - PubMed

LinkOut - more resources