Transcriptomic analysis of wild Cannabis sativa: insights into tissue- and stage-specific expression and secondary metabolic regulation
- PMID: 40419957
- PMCID: PMC12105235
- DOI: 10.1186/s12864-025-11697-5
Transcriptomic analysis of wild Cannabis sativa: insights into tissue- and stage-specific expression and secondary metabolic regulation
Abstract
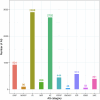
Cannabis sativa is a medicinally and economically significant plant known for its production of cannabinoids, terpenoids, and other secondary metabolites. This study presents a transcriptomic analysis to elucidate tissue-specific expression and regulatory mechanisms across leaves, stems, and roots. A total of 2,530 differentially expressed genes (DEGs) were identified, with key genes such as terpene synthase (TPS) and phenylalanine ammonia-lyase (PAL) exhibiting elevated expression in leaf tissues, emphasizing their roles in terpenoid and phenylpropanoid biosynthesis. Alternative splicing (AS) analysis revealed 8,729 distinct events, dominated by exon skipping, contributing to transcriptomic diversity. Long non-coding RNA (lncRNA) prediction identified 3,245 candidates, many of which displayed tissue-specific expression patterns and co-expression with metabolic genes, suggesting regulatory roles in secondary metabolism. Additionally, 12,314 SNPs and 2,786 INDELs were detected, with notable enrichment in genes associated with secondary metabolite biosynthesis, particularly in leaf tissues. These findings advance the understanding of molecular mechanisms governing secondary metabolism and genetic diversity in C. sativa, providing valuable insights for future metabolic engineering and breeding strategies to enhance cannabinoid production.
Keywords: Cannabis sativa; Alternative splicing; Genetic variation.; Secondary metabolism; Transcriptomics.
© 2025. The Author(s).
Conflict of interest statement
Declarations. Ethics approval and consent to participate: Not applicable. Consent for publication: Not applicable. Competing interests: The authors declare no competing interests.
Figures


Similar articles
-
Genome-Wide Analysis of Alternative Splicing and Non-Coding RNAs Reveal Complicated Transcriptional Regulation in Cannabis sativa L.Int J Mol Sci. 2021 Nov 5;22(21):11989. doi: 10.3390/ijms222111989. Int J Mol Sci. 2021. PMID: 34769433 Free PMC article.
-
Characterization of the Cannabis sativa glandular trichome epigenome.BMC Plant Biol. 2024 Nov 14;24(1):1075. doi: 10.1186/s12870-024-05787-x. BMC Plant Biol. 2024. PMID: 39538149 Free PMC article.
-
Generation of a Comprehensive Transcriptome Atlas and Transcriptome Dynamics in Medicinal Cannabis.Sci Rep. 2019 Nov 12;9(1):16583. doi: 10.1038/s41598-019-53023-6. Sci Rep. 2019. PMID: 31719627 Free PMC article.
-
Characterisation of Cannabis glandular trichome development reveals distinct features of cannabinoid biosynthesis.Plant Cell Rep. 2025 Jan 13;44(2):30. doi: 10.1007/s00299-024-03410-9. Plant Cell Rep. 2025. PMID: 39806251
-
Comprehending and improving cannabis specialized metabolism in the systems biology era.Plant Sci. 2020 Sep;298:110571. doi: 10.1016/j.plantsci.2020.110571. Epub 2020 Jun 27. Plant Sci. 2020. PMID: 32771172 Review.
References
-
- Mechoulam R, Parker LA, Gallily R, 11S-19S. Cannabidiol: an overview of some Pharmacological aspects. J Clin Pharmacol. 2002;42. 10.1002/j.1552-4604.2002.tb05998.x. - PubMed
-
- Silva Sofras FM, Desimone MF. Entourage effect and analytical chemistry: chromatography as a tool in the analysis of the secondary metabolism of Cannabis sativa L. Curr Pharm Des. 2023;29:394–406. 10.2174/1381612829666221103093542. - PubMed
MeSH terms
Substances
Grants and funding
LinkOut - more resources
Full Text Sources
Research Materials

