. 2025 May 26;26(1):137.
doi: 10.1186/s12859-025-06162-9.

DRaCOon: a novel algorithm for pathway-level differential co-expression analysis in transcriptomics

Affiliations

DRaCOon: a novel algorithm for pathway-level differential co-expression analysis in transcriptomics

Fernando M Delgado-Chaves et al. BMC Bioinformatics. .

Abstract

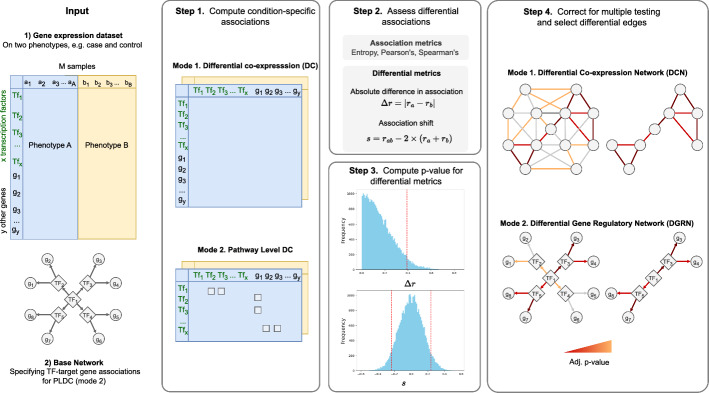
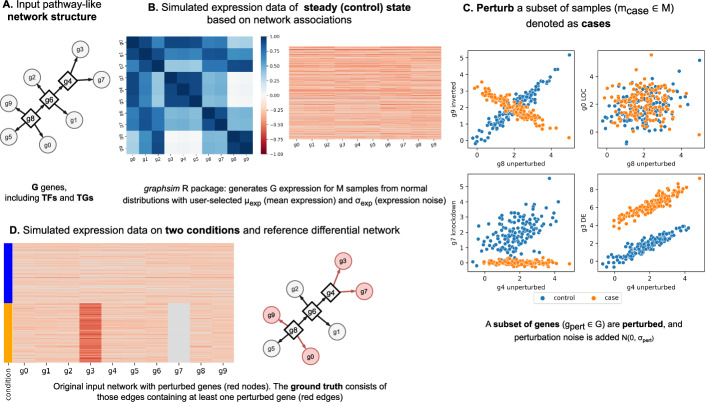
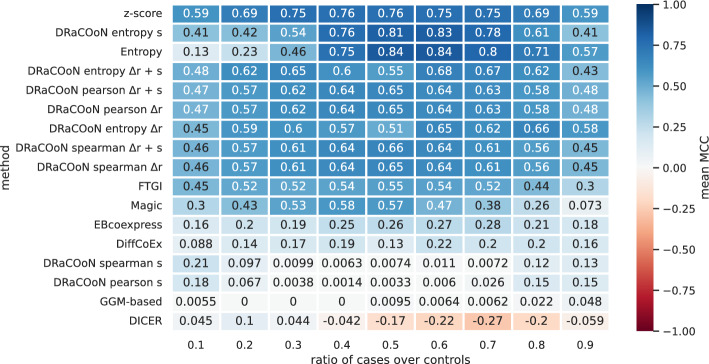
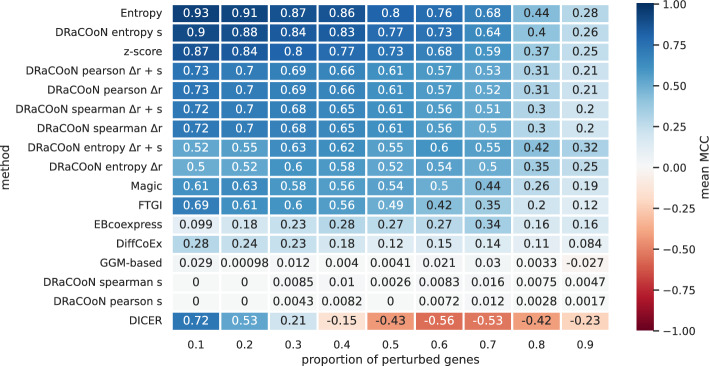
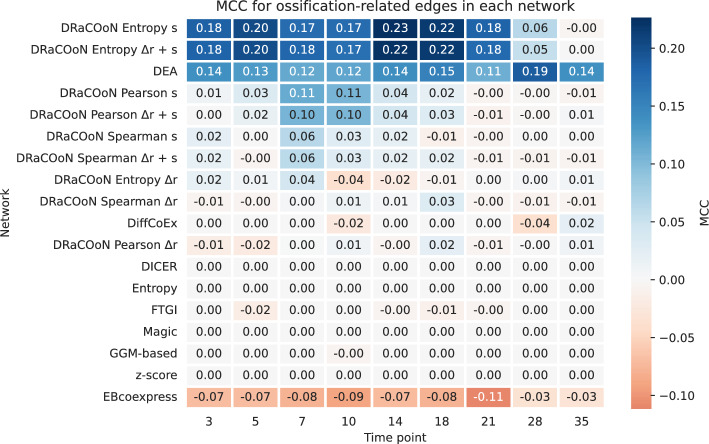
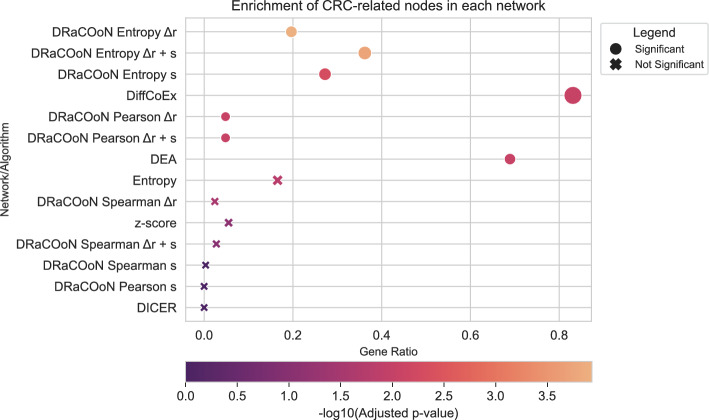
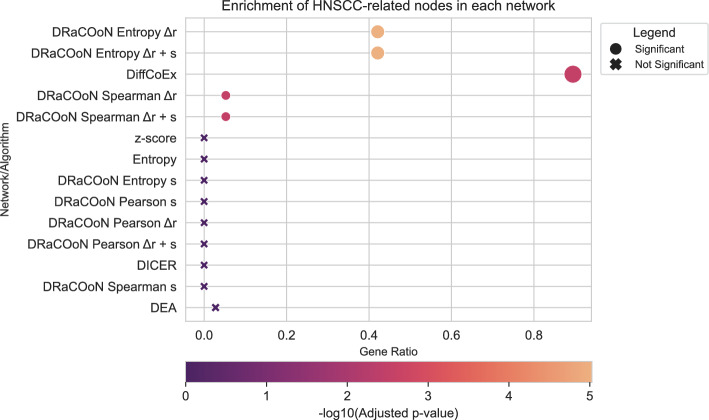
Understanding the molecular mechanisms underlying diseases is crucial for more precise, personalized medicine. Pathway-level differential co-expression analysis, a powerful approach for transcriptomics, identifies condition-specific changes in gene-gene interaction networks, offering targeted insights. However, a key challenge is the lack of robust methods and benchmarks specifically for evaluating algorithms' ability to identify disrupted gene-gene associations across conditions. We introduce DRaCOoN (Differential Regulatory and Co-expression Networks), a Python package and web tool for pathway-level differential co-expression analysis. DRaCOoN uniquely integrates multiple association and differential metrics, with a novel, computationally efficient permutation test for significance assessment. Crucially, DRaCOoN also provides a benchmarking framework for comprehensive method evaluation. Extensive benchmarking on simulated data and three real-world datasets (bone healing, colorectal cancer, and head/neck carcinoma) showed that DRaCOoN, particularly with an entropy-based association measure and the s differential metric, consistently outperforms eight other methods. It remains highly accurate in balanced datasets, robust to varying gene perturbation levels, and identifies biologically relevant regulatory changes. Furthermore, DRaCOoN serves as both a powerful tool and a benchmarking framework for elucidating disease mechanisms from transcriptomics data, advancing precision medicine by uncovering critical gene regulatory alterations.

Keywords: Differential networking; Differential regulation; Disease module identification; Network-based gene expression analysis; Pathway-level differential co-expression.


Conflict of interest statement

Declarations. Ethics approval and consent to participate: Not applicable. Consent for publication: Not applicable. Competing interests: The authors declare no Conflict of interest. Authors’ information: Not applicable.

Figures

Fig. 1
Fig. 1
Schematic overview of DRaCOoN’s workflow and functionalities. The first step converts an input expression matrix with annotated conditions into a co-expression network represented as a gene-gene matrix. The TF-TG interactions of a GRN, in case of mode 2, are used to construct a DGRN. Thus, we can designate which interactions are evaluated for differential networking: all (mode 1) or TFs-TGs in the GRN (mode 2). In the second step, a background model based on the permutation test is used for estimating the statistical significance of the absolute difference Δr and the shift difference s. In the third step, we compute the differential metrics for network edges based on a selected association metric (entropy-based, Pearson’s, or Spearman’s) and assign p-values to the edges based on the background model. Lastly, in Step 4, the differential edges are corrected for multiple testing. Edges identified as significant constitute the final differential network
Fig. 2
Fig. 2
The simulation framework is used for benchmarking. A. The simulation begins initializing a tree-like network structure with user-defined TFs-TGs. In this network, square boxes represent TFs and circles represent target genes. B. The graphsim R package simulates gene expression data for a specified number of samples M based on network associations, generating a gene-gene similarity matrix and drawing expression values from a multivariate normal distribution. C. The data is split into control and case groups, introducing specific perturbations such as gene knockdown, gene differential expression (DE), inversion, and loss of co-expression (LOC), altering regulatory interactions within the GRN. Additionally, Gaussian noise (N) is added. D. A ground truth network is defined (edges highlighted in red), and details of the perturbed expression data and edges are saved for performance assessment
Fig. 3
Fig. 3
Aggregated MCC for the evaluated pathway-level DC methods, including different DRaCOoN configurations, across a spectrum of case-to-total sample ratios. The x-axis represents the ratio of case samples to the total number of samples, ranging from 0.1 to 0.9. Each cell in the heatmap contains the mean MCC score for an algorithm at a specific case-to-total sample ratio, averaged over five runs and five simulations, and the five different perturbation approaches. The algorithms are ranked by their mean performance across all scenarios, and the color gradient reflects the MCC value, with blue intensity indicating higher performance
Fig. 4
Fig. 4
Aggregated MCC the evaluated pathway-level DC methods, including different DRaCOoN configurations, with varied proportions of perturbed genes. The x-axis represents the ratio of perturbed genes, ranging from 0.1 to 0.9. Each cell in the heatmap contains the mean MCC score for an algorithm at a specific ratio of perturbed genes, averaged over five runs and five simulations and the five different perturbation approaches. The algorithms are ranked by their mean performance across all scenarios, and the color gradient reflects the MCC value, with blue intensity indicating higher performance
Fig. 5
Fig. 5
Time-resolved ORA depicting the significance of the reconstructed networks highlighting enrichment on the GO term “ossification” (GO:0001503). Each point corresponds to a gene set captured by each network or DEGs (in the y-axis), and the x-axis shows the gene ratio. The color intensity indicates the Adj. p-value from Fisher’s Exact Test, with a gradient color map ranging from low (light) to high (dark) significance, as normalized by the color bar at the bottom. Point size represents the number of genes that represent the GO term, while gene ratio represents the fraction of identified GO-term-related genes over the total number of known GO-term-related genes. Networks at each time point are arranged in a grid, allowing for a comparative view of regulatory changes over time. Only significant interactions (FDR-BH-corrected p-value <0.01) are represented
Fig. 6
Fig. 6
MCC values for classification of ossification-related edges across time points for different networks. Networks are ranked by their mean MCC value to highlight those with the highest predictive performance for bone healing-related interactions. The MCC values are presented on a color gradient ranging from -1 to 1, where 1 indicates a perfect prediction, 0 is no better than random chance, and -1 indicates an inverse prediction
Fig. 7
Fig. 7
Enrichment analysis of CRC-related nodes across gene networks, visualized using -log10 transformed adjusted p-values. The plot displays results from Fisher’s exact tests. Point size reflects the number of overlapping genes. Circles denote significant enrichments (adjusted p-value < 0.01), and X markers indicate non-significant results
Fig. 8
Fig. 8
Enrichment analysis of HNSCC-related nodes across gene networks, visualized using -log10 transformed adjusted p-values. The plot displays results from Fisher’s exact tests. Point size reflects the number of overlapping genes. Circles denote significant enrichments (adjusted p-value < 0.05), and X markers indicate non-significant results

Similar articles

References

    1. Ideker T, Krogan NJ. Differential network biology. Mol Syst Biol. 2012;8(1):565. - PMC - PubMed
    1. Chowdhury HA, Bhattacharyya DK, Kalita JK. (Differential) co-expression analysis of gene expression: a survey of best practices. IEEE/ACM Trans Comput Biol Bioinform. 2020;17(4):1154–73. 10.1109/TCBB.2019.2893170. - PubMed
    1. Kakati T, Bhattacharyya DK, Barah P, Kalita JK. Comparison of methods for differential co-expression analysis for disease biomarker prediction. Comput Biol Med. 2019;113: 103380. 10.1016/j.compbiomed.2019.103380. - PubMed
    1. Mirlekar B. Co-expression of master transcription factors determines cd4+ t cell plasticity and functions in auto-inflammatory diseases. Immunol Lett. 2020;222:58–66. 10.1016/j.imlet.2020.03.007. - PubMed
    1. Savino A, Provero P, Poli V. Differential co-expression analyses allow the identification of critical signalling pathways altered during tumour transformation and progression. Int J Mol Sci. 2020;21(24):9461. 10.3390/ijms21249461. - PMC - PubMed

LinkOut - more resources