. 2025 May 26;23(1):244.
doi: 10.1186/s12964-025-02233-9.

TRIM29 upregulation contributes to chemoresistance in triple negative breast cancer via modulating S100P-β-catenin axis

Affiliations

TRIM29 upregulation contributes to chemoresistance in triple negative breast cancer via modulating S100P-β-catenin axis

Qitong Wu et al. Cell Commun Signal. .

Abstract

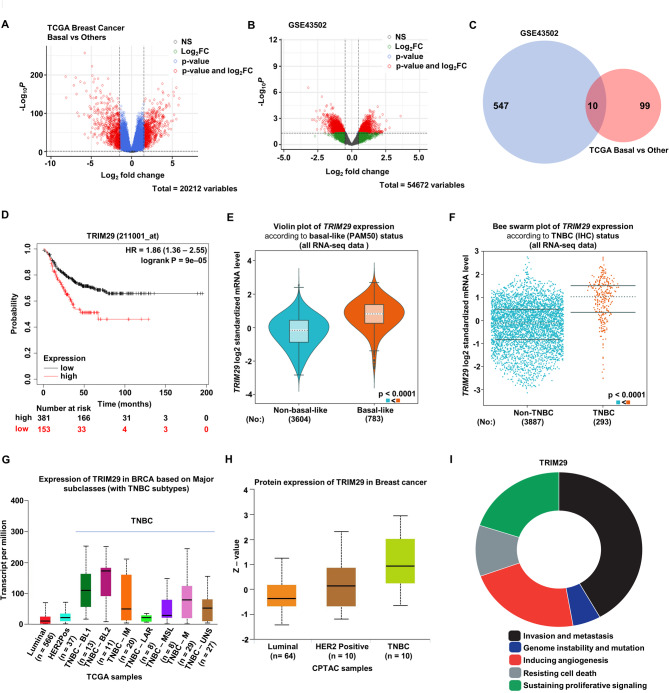
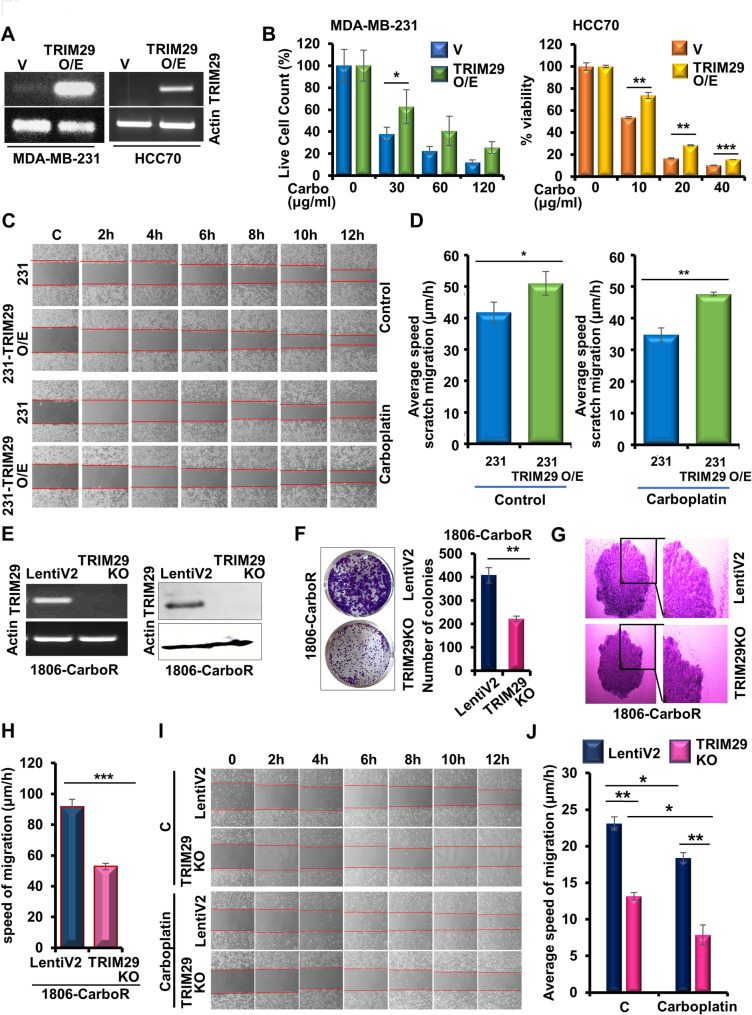
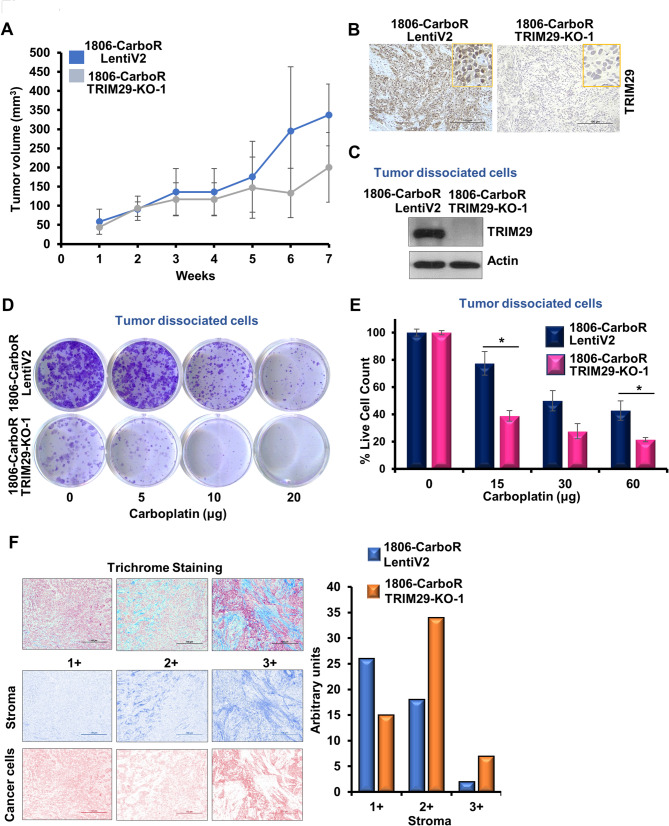
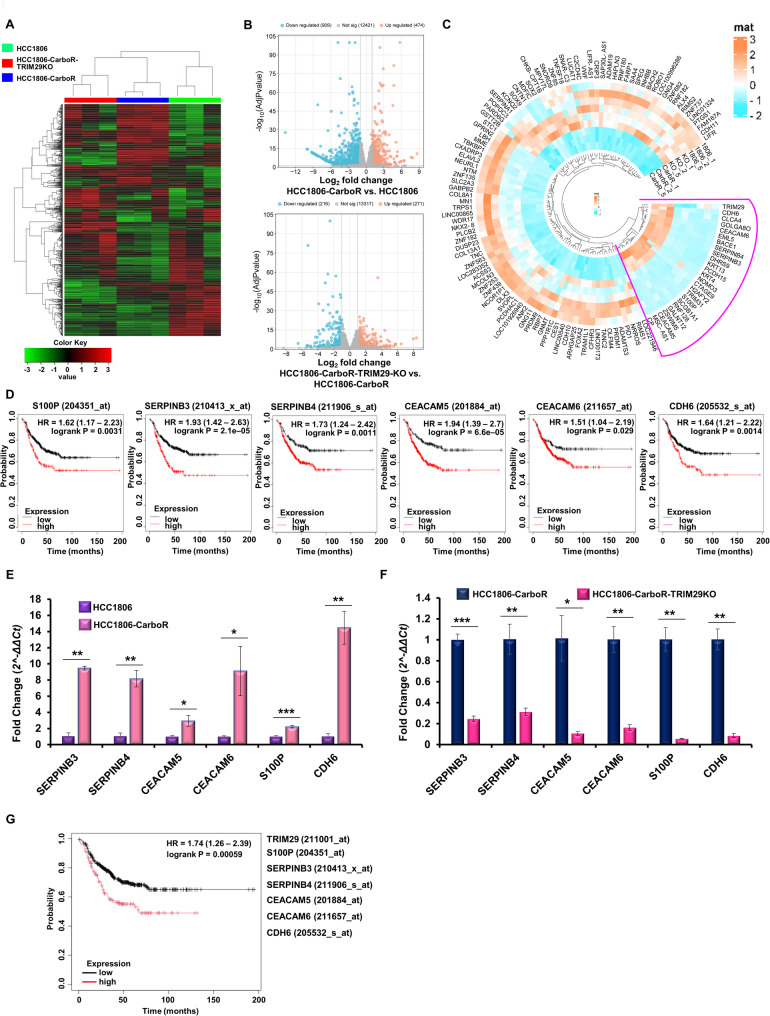
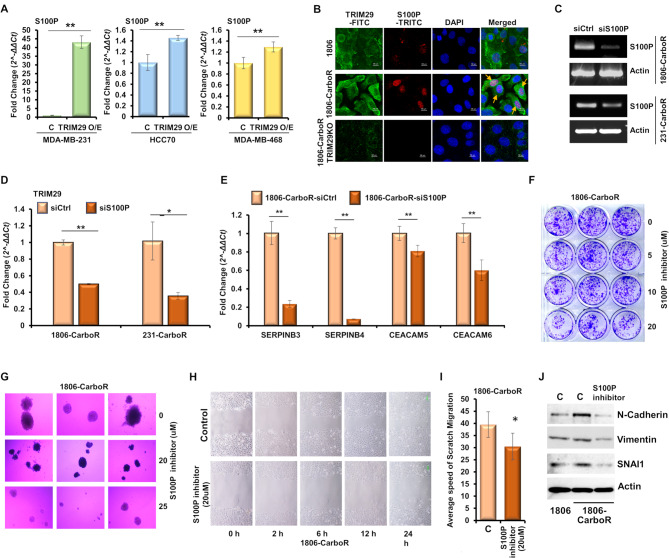
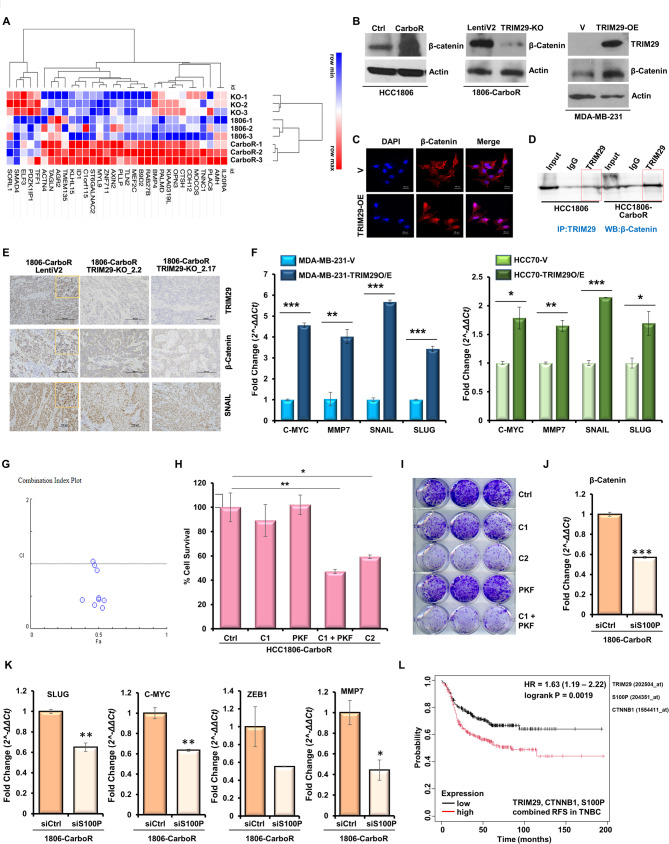
Triple negative breast cancer, an inherently aggressive disease, is further impaired by the limited therapeutic options and chemotherapy-resistance; hence, elucidating the signaling nodes underlying chemotherapy resistance is of major interest. Focusing on the differentially expressed genes in recurrent TNBC, we identified TRIM29, a ubiquitin ligase belonging to TRIM family, as a uniquely enriched protein in chemoresistant TNBC. Here, we demonstrate that chemoresistant TNBC cells are inherently aggressive, exhibiting elevated growth and migration potential compared to chemosensitive cells, and in particular, they possess higher TRIM29 expression whose expression level modulation results in altered chemosensitivity. TRIM29 overexpression reduces chemotherapy response whereas TRIM29 knockout not only increases chemosensitivity but also reduces TNBC tumor growth. Tumor-dissociated cells maintain TRIM29 knockout status as well as exhibit similar functional alterations as chemoresistant TNBC cells. Mechanistically, RNA-sequencing of parental-chemosensitive, chemoresistant-inherently overexpressing TRIM29 and chemoresistant-TRIM29 knockout TNBC cells reveals a unique set of genes (S100P, SERPINB3, SERPINB4, CEACAM5, CEACAM6 and CDH6) showing significant upregulation with the acquisition of chemoresistance and downregulation with the TRIM29 knockout. Furthermore, an enrichment of β-catenin pathway in chemoresistant TNBC cells is observed. We uncovered a functional network where S100P, a metastasis inducing secretory factor, bidirectionally interacts with TRIM29, and modulates the expression of SERPINB3, SERPINB4, CEACAM5, CEACAM6 as well as β-catenin pathway genes. Showing the functional importance, S100P inhibitor reduces the growth and mammosphere formation in chemoresistant TNBC. Moreover, combining β-catenin inhibitor with chemotherapy shows synergistic inhibition of chemoresistant TNBC cells. Indeed, higher expression of TRIM29, S100P and β-catenin associates with reduced recurrence free survival. This work proposes TRIM29 as an important node that modulates a unique gene network in chemoresistant TNBC and whose biological impact is mediated by modulation of S100P and β-catenin.


Conflict of interest statement

Declarations. Ethics approval and consent to participate: No clinical data. All animal studies were approved by JHU ACUC. Consent for publication: All authors consent for publication. Competing interests: The authors declare no competing interests.

Figures

Fig. 1
Fig. 1
TRIM29 is highly expressed in recurrent TNBC. (A) Volcano plot visualizing differentially expressed genes in TNBC tumors compared to luminal and Her2 subtypes. The gene set was acquired from the TCGA database. (B) Volcano plot showing differentially expressed genes in TNBC tumors with recurrent disease compared to the ones without recurrence. Gene set used was GSE43502 from Gene Expression Omnibus. (C) Venn diagram showing numbers of overlapping genes with LogFC > 1 from TCGA dataset and GSE43502 dataset. (D) Kaplan-Meier curves indicating TNBC recurrence-free survival with high- or low- expression of TRIM29. Log-rank tests of survival patterns were used to obtain the p values. (E) Violin plot representing TRIM29 expression within 4387 breast cancer samples. The breast cancer subtype classification was based on PAM50 status. (F) Bee swarm plot representing TRIM29 expression in 4180 breast cancer samples. The breast cancer subtype classification was done via IHC status. (G) UALCAN analysis showing TRIM29 expression among different subtypes of breast cancer in TCGA dataset. (H) UALCAN analysis showing TRIM29 protein expression level among the three major subtypes of breast cancer from CPTAC dataset. (I) Visualization of cancer hallmark distribution of TRIM29 in donut chart. Each color represents a cancer hallmark. The occupied area of each color is proportional to NPMI (normalized point-wise mutual information)
Fig. 2
Fig. 2
Chemoresistant TNBC cells exhibit distinct functional characteristics and higher TRIM29 expression. (A) Result of MTT assay presented as line graph comparing % cell viability between chemoresistant TNBC cells and parental cells upon different concentrations of carboplatin. (B) Representative images of colony formation assay of chemoresistant cells and parental cells in different treatment groups. Concentrations of carboplatin were presented in µg per ml. (C) Representative images of solid mammospheres formed by chemoresistant TNBC cells and parental cells. Bar graphs show the number of mammospheres. (D) Representative images of spheroid migration comparing chemoresistant cells with parental cells. Bar graphs show the speed of migration by the cells from the core. (E) Representative images showing the progression of scratch migration assay of parental and chemoresistant cells. Bar graphs indicate the average speed of migration by migrating parental and chemoresistant cells. (F) Representative images of transwell migration assay comparing carboplatin-resistant cells with respected parental cells. (G) Immunoblotting of TRIM29 in parental and chemoresistant cells. Actin served as the loading control. (H) Immunofluorescence analysis of TRIM29 in HCC1806 and 1806-CarboR cells. DAPI was used to stain nuclei. Rhodamine Phalloidin was used to stain F-actin. Scale bar = 25 μm. Data represents n = 3 independent experiments. *p ≤ 0.05, ***p ≤ 0.001
Fig. 3
Fig. 3
TRIM29 overexpression or knockout modifies the cell viability, migration potential and response to chemotherapy. (A) RT-PCR showing TRIM29 expression level in TNBC cells transfected with vehicle or TRIM29-overexpression plasmid. (B) Bar graph showing % live cell count in trypan blue exclusion assay and % cell viability in MTT comparing MDA-MB-231 and HCC70 cells treated with transfection vehicle or with TRIM29 overexpression plasmid, in the presence of absence of carboplatin. (C) Representative images showing the progression of scratch migration assay of untreated and carboplatin treated MDA-MB-231 cells upon TRIM29 overexpression in comparison to vehicle control cells. (D) Bar graphs show the average speed of migration comparing cells with and without overexpression of TRIM29, and carboplatin treatment. (E) RT-PCR and immunoblot analysis showing the expression of TRIM29 in HCC1806 carboplatin-resistant cells with TRIM29 knocked out by CRISPR (TRIM29KO) and cells treated with vector (LentiV2). Actin was served as the loading control. (F) Representative images of colony formation assay of 1806-CarboR cells upon stable knockout of TRIM29. Bar charts show the numbers of colonies. (G) Representative images of spheroid migration comparing LentiV2 and TRIM29KO 1806-CarboR cells. (H) Bar graph showing the average speed of spheroid migration comparing LentiV2 and TRIM29KO. Migration distances were recorded for 6 days to calculate the speed of migration. (I) Representative images showing the progression of scratch migration assay of LentiV2 and TRIM29KO 1806-CarboR cells in the presence or absence of carboplatin. (J) Bar graph showing the average speed of migration comparing LentiV2 and TRIM29KO in the presence or absence of carboplatin. Migration distances were recorded for 6 days to calculate the speed of migration. Data represents n = 3 independent experiments. *p ≤ 0.05, **p ≤ 0.01, ***p ≤ 0.001
Fig. 4
Fig. 4
TRIM29 knockout reduces tumor growth of chemoresistant TNBC cells. (A) Line graph showing growth of LentiV2 and TRIM29-KO 1806-CarboR cells-derived tumors in NOD/SCID mice. (B) Representative IHC images and (C) immunoblotting showing TRIM29 in LentiV2 and TRIM29-KO 1806-CarboR cells derived from tumors. Actin was served as the loading control. (D) Representative images of colony formation assay of tumor dissociated cells from LentiV2 and TRIM29-KO 1806-CarboR cells-derived tumors, in the presence or absence of carboplatin treatment. (E) Bar graph showing % live cell count in trypan blue dye exclusion assay of tumor dissociated cells from LentiV2 and TRIM29-KO 1806-CarboR cells-derived tumors. Data represents n = 3 independent experiments. *p ≤ 0.05. (F) Representative images of Masson-Trichrome staining showing 1+, 2 + and 3 + staining levels. Tumors were evaluated for the stromal and epithelial content based on the staining intensity and distribution. Bar graph represents the accumulation of stromal cells in 1806-CarboR-LentiV2 and 1806-CarboR-TRIM29-KO- derived tumors (H score)
Fig. 5
Fig. 5
RNA-seq analysis shows that modulation of TRIM29 in chemoresistant TNBC cells alters multiple genes. (A) Heatmap representing the differentially expressed genes (DEGs) between HCC1806-parental, HCC1806-CarboR and TRIM29KO 1806-CarboR cells. (B) Volcano plots showing the DEGs between HCC1806-CarboR versus HCC1806 cells; and TRIM29KO-1806-CarboR versus HCC1806-CarboR cells, respectively. (C) Circular heatmap showing the DEGs specifically downregulated/upregulated in HCC1806-CarboR cells whose expression exhibits opposite trends upon TRIM29 knockout, and similar to HCC1806 cells. Marked up portion represents n = 25 DEGs of special interest. (D) Kaplan-Meier curves showing the recurrence-free survival (RFS) for the TNBC (using the median of expression as cutoff) with high and low expression of S100P, SERPINB3, SERPINB4, CEACAM5, CEACAM6 and CDH6, respectively. Higher expression of six genes-S100P (Number at risk: low-398, high-136), SERPINB3 (Number at risk: low-360, high-174), SERPINB4 (Number at risk: low-198, high-336), CEACAM5 (Number at risk: low-212, high-322), CEACAM6 (Number at risk: low-136, high-398) and CDH6 (Number at risk: low-359, high-175). High expression of the mentioned genes was associated with worse prognosis. (E) Bar graph shows the real-time PCR mRNA expression profile of SERPINB3, SERPINB4, CEACAM5, CEACAM6, S100P and CDH6 in HCC1806 and HCC1806-CarboR cells. (F) Bar graph shows the real-time PCR mRNA expression profile of SERPINB3, SERPINB4, CEACAM5, CEACAM6, S100P and CDH6 in HCC1806-CarboR and TRIM29KO-HCC1806-CarboR cells. (G) Kaplan–Meier curve showing recurrence-free survival (RFS) for the TNBC patients with high or low mean expression of SERPINB3, SERPINB4, CEACAM5, CEACAM6, S100P, CDH6 and TRIM29. (Number at risk: Low-399, high-135) *p = 0.00059
Fig. 6
Fig. 6
TRIM29 overexpression increases S100P expression while S100P silencing reduces the expression of TRIM29, SERPINB3, SERPINB4, CEACAM5, CEACAM6. (A) Bar graph shows the mRNA expression profile of S100P upon TRIM29 overexpression in multiple TNBC cell lines using real time PCR assay. (B) Representative images showing the immunocytochemical analysis using S100P and TRIM29 antibodies in HCC1806, HCC1806-CarboR and HCC1806CarboR-TRIM29KO cells. (C) Expression level of S100P in carboplatin resistant TNBC cells (1806-CarboR and 231-CarboR) transfected with scramble control or siS100P as indicated. Actin is included as control. (D) Bar graph shows the real-time PCR mRNA expression profile of TRIM29 in HCC1806-CarboR and MDA-MB-231-CarboR cells transfected with scramble control or siS100P as indicated. (E) Bar graph shows the mRNA expression profile of SERPINB3, SERPINB4, CEACAM5 and CEACAM6 in HCC1806-CarboR cells transfected with scramble control or siS100P as indicated. (F) Representative images of colony formation assay of HCC1806-CarboR cells treated with S100P inhibitor. (G) Representative images of mammosphere formation assay of HCC1806-CarboR cells treated with S100P inhibitor. (H, I) Representative images of scratch migration assay in 1806-CarboR cells treated with various concentration of S100P inhibitor as indicated. Bar graph shows the average speed of migration. (J) Immunoblot analysis of HCC1806 and HCC1806-CarboR cells treated with 20 µM S100P inhibitor using antibodies as indicated
Fig. 7
Fig. 7
Overexpression of TRIM29 results in increased expression of β-catenin which shows functional significance. (A) Heatmap of customized β-catenin pathway signature in HCC1806-parental, HCC1806-CarboR and TRIM29KO 1806-CarboR cells. (B) Representative images of immunoblotting of β-catenin in HCC1806-parental and HCC1806-CarboR cells (left panel). Immunoblotting of TRIM29 and β-catenin in LentiV2-1806-CarboR and TRIM29KO-1806-CarboR (center panel). Immunoblotting of TRIM29 and β-catenin in MDA-MB-231 cells transfected with TRIM29 overexpression plasmid (right panel). (C) Representative ICC images of β-catenin expression in MDA-MB-231 cells transfected with TRIM29 overexpression plasmid (bottom panel). (D) Immunoblot showing β-catenin level immunoprecipitated with TRIM29 in HCC1806 and HCC1806-CarboR cells. (E) Representative IHC images of the expression of TRIM29, β-catenin and SNAIL in the tumor sections from LentiV2 and TRIM29-KO 1806-CarboR cells-derived tumors. Scale bar, 100 μm. Inset shows the nuclear staining. (F) Bar graph shows the real-time PCR mRNA expression profile of β-catenin-responsive genes (C-MYC, MMP7, SNAIL and SLUG) in MDA-MB-231 and HCC70 cells transfected with TRIM29 overexpression plasmid. (G) HCC1806-CarboR cells were treated with various concentration of carboplatin and PKF118-310, alone or in combination. Following the treatment, the cells were subjected to MTT assay and combination index values were calculated using CompuSyn software. CI < 1 shows synergism, CI = 1 shows additivity and CI > 1 shows antagonism (CI = Combination index). (H) Bar graph represents % cell survival of HCC1806-CarboR cells treated with the indicated concentration of carboplatin (C, untreated, C1, 5 µg/ml; C2, 10 µg/ml; PKF, 0.3 µM PKF118-310) and PKF118-310 either as monotherapy or in combination, as indicated. (I) Representative images of colony formation assay in HCC1806-CarboR cells treated with carboplatin and PKF118-310 either as monotherapy or in combination, as indicated. (J, K) Bar graph shows the real-time PCR mRNA expression profile of β-catenin (J), and β-catenin-responsive genes (SLUG, C-MYC, ZEB1 and MMP7) (K) in 1806-CarboR cells treated with scramble or S100PsiRNA, as indicated. (L) Kaplan–Meier curve showing recurrence-free survival (RFS) for the TNBC patients (classified with PAM50) with high or low mean expression of TRIM29, CTNNB1 (β-catenin), S100P; (number at risk: low-221, high-221). *p = 0.045. Data represents n = 3 independent experiments. *p ≤ 0.05, **p ≤ 0.01, ***p ≤ 0.001

References

    1. Sung H, Ferlay J, Siegel RL, Laversanne M, Soerjomataram I, Jemal A, Bray F, Global Cancer Statistics 2020.: GLOBOCAN estimates of incidence and mortality worldwide for 36 cancers in 185 countries, CA: a Cancer Journal for Clinicians. 2021;71:209–49. - PubMed
    1. Elias AD. Triple-negative breast cancer: a short review. Am J Clin Oncol. 2010;33:637–45. - PubMed
    1. Lehmann BD, Bauer JA, Chen X, Sanders ME, Chakravarthy AB, Shyr Y, Pietenpol JA. Identification of human triple-negative breast cancer subtypes and preclinical models for selection of targeted therapies. J Clin Invest. 2011;121:2750–67. - PMC - PubMed
    1. Lehmann BD, Pietenpol JA. Identification and use of biomarkers in treatment strategies for triple-negative breast cancer subtypes. J Pathol. 2014;232:142–50. - PMC - PubMed
    1. Bai X, Ni J, Beretov J, Graham P, Li Y. Triple-negative breast cancer therapeutic resistance: where is the Achilles’ heel? Cancer Lett. 2021;497:100–11. - PubMed

MeSH terms

LinkOut - more resources