. 2025 May 26;13(1):117.
doi: 10.1186/s40478-025-02021-z.

Lack of junctional adhesion molecule (JAM)-B traps CD8 T cells in CNS border zones and ameliorates autoimmune neuroinflammation

Affiliations

Lack of junctional adhesion molecule (JAM)-B traps CD8 T cells in CNS border zones and ameliorates autoimmune neuroinflammation

Javier Pareja et al. Acta Neuropathol Commun. .

Abstract

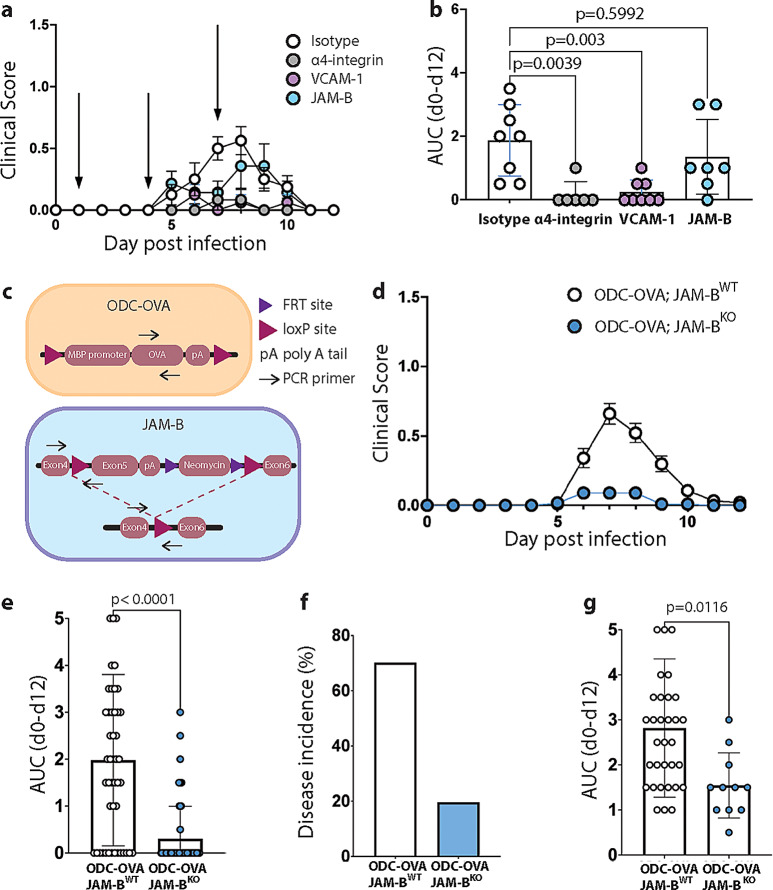
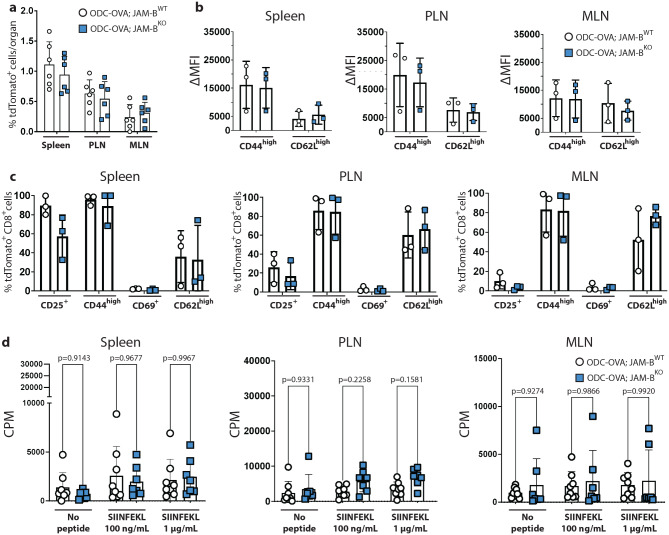
The endothelial blood-brain barrier (BBB) tightly controls T cell entry into the central nervous system (CNS). T cell extravasation across the BBB involves a multi-step cascade with a predominant role of α4β1-integrins. In contrast to CD4 T cells, α4β1-integrin mediated CD8 T cell interaction with the BBB was proposed to involve the tight junction protein junctional adhesion molecule (JAM)-B. Here, we made use of ODC-OVA mice expressing ovalbumin as neo-self-antigen in oligodendrocytes that is solely visible to CD8 T cells, allowing to investigate CD8 T cell-mediated autoimmune neuroinflammation. We generated JAM-B-deficient ODC-OVA mice (ODC-OVA; JAM-BKO mice) and compared CD8 T cell mediated autoimmune neuroinflammation to their ODC-OVA; JAM-BWT littermates. ODC-OVA; JAM-BKO mice developed ameliorated clinical disease, which was associated with a marked reduction in CD8 T cell infiltration into the CNS parenchyma. Surprisingly, lack of JAM-B did not affect CD8 T cell arrest or extravasation in spinal cord microvessels but rather resulted in CD8 T cell accumulation in the subarachnoid space and perivascular spaces in ODC-OVA; JAM-BKO mice. Detection of Jam-2 RNA expression in cells other than BBB endothelial cells contributing to CNS barriers including astrocytes forming the glia limitans, Bergmann glial cells, meningeal fibroblasts and choroid plexus epithelial cells suggests that JAM-B may regulate CD8 T cell entry into the CNS at barriers other than the BBB, particularly at the glia limitans. Thus, targeting JAM-B could provide a therapeutic strategy for treating neuroinflammation without disrupting T cell-mediated immune surveillance in CNS border compartments.

Keywords: BBB; CD8 T cell; CNS; Glia limitans; JAM-B; Neuroinflammation.


Conflict of interest statement

Declarations. Ethical approval: All animal experiments were conducted in strict accordance with the regulations and guidelines set by the Veterinary Office of the Canton of Bern, Switzerland. The study was approved by the Veterinary Office of the Canton Bern (permit no. BE31/17, BE55/20, BE73/2021 and BE98/2020), ensuring compliance with ethical standards for animal research. Consent for publication: Not applicable. Competing interests: The authors declare no competing interests.

Figures

Fig. 1
Fig. 1
Lack of JAM-B reduces clinical severity of CD8 T cell mediated neuroinflammation in ODC-OVA mice. a-b) Freshly isolated naïve OT-I cells were adoptively transferred into ODC-OVA; JAM-BWT mice one day prior to i.p. injection of LCMV-OVA. Mice received i.v. injections of rat-anti mouse function-blocking antibodies against JAM-B (green, n = 7), VCAM-1 (red, n = 8), α4- integrins (purple, n = 6), or an isotype control (black, n = 8) on days 1, 4 and 7 after LCMV-OVA infection. Mice were monitored twice and scored once daily. Clinical disease course (a) and area under the curve (b) are represented as mean ± SEM. Data is representative of 2 independent experiments. Data were analyzed using an ordinary one-way ANOVA with Tukey’s multiple comparisons test. c) Schematic representation of the genetic constructs introduced in the ODC-OVA; JAM-BKO mouse and location of PCR primers used for their genotyping. (d-g) Freshly isolated naïve OT-I T cells were adoptively transferred into ODC-OVA; JAM-BWT and ODC-OVA; JAM-BKO mice one day prior to peripheral activation with LCMV-OVA. Mice were monitored twice and scored once daily. d) Clinical disease course of OT-I induced neuroinflammation in ODC-OVA; JAM-BWT and ODC-OVA; JAM-BKO mice shown as mean ± SEM. Data is representative of 6 independent experiments. e) Overall clinical severity of disease in ODC-OVA; JAM-BWT (black, n = 47) and ODC-OVA; JAM-BKO (blue, n = 56) mice based on the area under the curve (AUC) of B). Data were analyzed using a two-sided unpaired parametric T test. Data is representative of 6 independent experiments. f) Percentage of ODC-OVA; JAM-BWT (n = 47) and ODC-OVA; JAM-BKO (n = 56) mice developing a clinical disease. g) Overall clinical severity of the ODC-OVA; JAM-BWT (black, n = 33) and ODC-OVA; JAM-BKO (blue, n = 11) mice that developed a clinical disease only, shown as area under the curve (AUC). Data were analyzed using a two-sided unpaired parametric T test. Data are representative of 6 independent experiments
Fig. 2
Fig. 2
Lack of JAM-B does not affect naïve CD8 T cell homing and activation in peripheral lymphoid organs. (a) 107 naïve tdTomato+ OT-I cells were intravenously injected into ODC-OVA; JAM-BWT and ODC-OVA; JAM-BKO mice. Single- cell suspensions of the spleen, peripheral and mesenteric lymph nodes were harvested at 4 h after T cell injection and analyzed by flow cytometry. The bar graph shows the percentage of tdTomato+ OT-I cells detected in the spleen, peripheral (PLN) and mesenteric (MLN) lymph nodes. Data are representative of 3 independent experiments and are represented as mean ± SD. Data were analyzed by an ordinary one-way ANOVA with Tukey’s multiple comparisons test. b-c) Freshly isolated naïve OT-I cells were adoptively transferred into ODC-OVA; JAM-BWT and ODC-OVA; JAM-BKO mice one day prior to peripheral activation with LCMV-OVA. Spleen, peripheral and mesenteric lymph nodes were harvested on day 3 after LCMV-OVA infection. Single cell suspensions were stained for CD44, CD62L, CD69 and CD25 and analyzed by flow cytometry. b) Mean fluorescence intensity (MFI) of CD8+ CD44high and CD8+ CD62Lhigh cells shown as mean ± SD after subtraction of the respective isotype MFI. c) Percentage of all tdTomato+ CD8 T cells stained positive for CD25, CD44, CD69 and CD62L. Data are representative of 3 mice and were analyzed by using an ordinary one-way ANOVA with Tukey’s multiple comparisons test. d) Proliferation of OT-I cells from the spleen, peripheral and mesenteric lymph nodes in the presence or absence of 100 ng/mL or 1 µg/mL of their cognate antigen SIINFEKL was assessed by incorporation of 3H thymidine, measured as counts per minute (CPM). Data are shown as mean ± SD and were analyzed by using an ordinary one-way ANOVA with Tukey’s multiple comparisons test. Data are representative of 8 ODC-OVA; JAM-BWT mice and 7 ODC-OVA; JAM-BKO mice
Fig. 3
Fig. 3
Lack of JAM-B impairs CD8 T cell migration into the CNS during neuroinflammation in ODC-OVA mice. a) Flow cytometry analysis of CNS infiltrating immune cells isolated from brains and spinal cords of ODC-OVA; JAM-BWT and ODC-OVA; JAM-BKO mice at day 7 after LCMV-OVA infection. Quantification is shown as absolute numbers per organ of CD45high infiltrating immune cells, CD45high CD8+ cells, CD45high CD4+ cells, CD45high CD11b+ monocytes/macrophages and CD45high CD11c+ dendritic cells. Numbers are show as mean ± SD, where each dot represents one mouse. Data are representative of 6 mice per condition. Data are analyzed by using an ordinary one-way ANOVA with Tukey’s multiple comparisons test. b-d) Naïve tdTomato+ OT-I cells were adoptively transferred into ODC-OVA; JAM-BWT and ODC-OVA; JAM-BKO mice one day prior to LCMV-OVA infection. Brains and spinal cords were harvested on day 7 after LCMV-OVA infection. Representative maximum intensity projection images from 100 μm thick vibratome sections from the brain (b) and cerebellum (c) and from 20 μm thick cryosections from the decalcified cervical, thoracic and lumbar vertebral column (d) of ODC-OVA; JAM-BWT and ODC-OVA; JAM-BKO mice obtained by laser scanning confocal microscopy. tdTomato+ OT-I cells are visible in red and nuclei were stained with DAPI and are visible in blue. Bottom panels show a higher magnification of the white dashed boxes on the top panels. Data are representative of 7 mice per genotype
Fig. 4
Fig. 4
CD8 T cells do not bind to recombinant JAM-B under static conditions in vitro. Number of in vitro activated OT-I cells (a) and in vivo activated OT-I cells (b-d), bound on slides coated with recombinant JAM-B (10 µM), VCAM-1 (10 µM), and JAM-C (10 µM) or the combination of JAM-B and JAM-C or JAM-B and VCAM-1 (10 µM per molecule) per field of view (FOV). Recombinant mouse DNER-IgG (10 µM) was used as a negative control. a) The bar on the right side shows the number of OT-I cells bound to the combination of recombinant mouse JAM-B and VCAM-1 after OT-I cell preincubation with a blocking antibody against α4-integrin. Data are shown as mean ± SD, analysed by one-way ANOVA with Tukey’s multiple comparisons test. Data are representative of 4 independent experiments performed in triplicates. b-d) In vivo activated OT-I cells were isolated from the spleen and peripheral lymph nodes of ODC-OVA; JAM-BWT (b) and ODC-OVA; JAM-BKO (c) mice on day 3 after LCMV-OVA infection. Bar graph in (d) shows the number of in vivo activated OT-I cells per field of view bound to recombinant mouse VCAM-1. Data are shown as mean ± SD, analysis by one-way ANOVA with Tukey’s multiple comparisons test. Data are representative of 3 independent experiments. e-f) Number of in vitro activated human CD8 (e) and CD4 (f) T cells per field of view bound to recombinant human JAM-B (100 nM), VCAM-1 (100 nM), JAM-C (100 nM), or the combination of JAM-B and JAM-C or JAM-B and VCAM-1 (100 nM per molecule). Data are shown as mean ± SD, analysis by one-way ANOVA with Tukey’s multiple comparisons test. Data are representative of 2 independent experiments in (e) and 1 in (f)
Fig. 5
Fig. 5
JAM-B does not suffice to arrest CD8 T cells under shear, but it favors their crawling. (a) Number of in vitro activated OT-I cells arrested per field of view (FOV) on recombinant mouse JAM-B (10 µM), VCAM-1 (10 µM), JAM-C (10 µM), or the combination of JAM-B and JAM-C or JAM-B and VCAM-1 (10 µM per molecule) under physiological flow. Recombinant mouse DNER was used as a negative control. Data are shown as mean ± SD and were analyzed by using an ordinary one-way ANOVA with Tukey’s multiple comparisons test. Data are representative of 3 independent experiments, where each experiment represents an individual T cell preparation. (b) Bar graphs depict crawling speed in µm/min of in vitro activated OT-I cells on 10 µM VCAM-1 and increasing concentrations of JAM-B. Values are pooled from six individual movies from 3 independent T cell preparations. Data are shown as mean ± SEM and were analyzed using ordinary one-way ANOVA with Tukey’s multiple comparisons test. For each condition 100–200 cells were tracked. (c) In vivo activated OT-I cells were isolated from the spleen and peripheral lymph nodes of ODC-OVA; JAM-BWT and ODC-OVA; JAM-BKO mice on day 3 after LCMV-OVA infection. Bar graphs depict the crawling speed in µm/min of in vivo activated OT-I cells on VCAM-1 alone or of equimolar concentrations of VCAM-1 and JAM-B. Values are pooled from two individual experiments, where each experiment represent an independent T cell preparation. Data are shown as mean ± SEM and were analyzed using a two-sided parametric T test. For each condition a minimum of 50 cells were tracked.
Fig. 6
Fig. 6
Lack of JAM-B does not affect CD8 T cell extravasation across the BBB during neuroinflammation. Freshly isolated naïve OT-I cells were adoptively transferred into ODC-OVA; JAM-BWT and ODC-OVA; JAM-BKO mice one day prior to peripheral activation with LCMV-OVA. Epifluorescence (a-d) and two-photon (g-h) intravital microscopy of the cervical spinal cord was performed on day 7 after LCMV-OVA infection. (a) Reconstruction of epifluoprescence intravital imaging of the cervical spinal cord from a ODC-OVA; JAM-BWT mouse. Four adjacent fields of view (FOV) were imaged per window. The spinal cord autofluorescence is visible in green. (b) CMFDA-labeled P14 cells (green) and Deep-Red Cell Tracker-labeled OT-I (magenta) in vitro activated cells were infused via a carotid artery catheter. Representative images of the inflamed cervical spinal cord of ODC-OVA; JAM-BWT and ODC-OVA; JAM-BKO mice 120 min post T-cell infusion. White arrow heads show extravascular CD8 T cells and white asterisks show CD8 T cells arrested within the cervical spinal cord microvasculature. Orange asterisk shows an out-of-focus cell. c, d) Number of in vitro activated P14 and OT-I cells arrested within cervical spinal cord microvessels of ODC-OVA; JAM-BWT and ODC-OVA; JAM-BKO mice (c) or found extravascular in the cervical spinal cord (d) at 0, 30, 60 and 120 min post T-cell infusion. Data were pooled from 4 mice per condition, analyzed using ordinary one-way ANOVA with Tukey’s multiple comparisons test, and shown as mean ± SD. e-f) 20 μm thick spinal cord cryosections from ODC-OVA; JAM-BWT and ODC-OVA; JAM-BKO mice at day 7 after LCMV-OVA infection were co-immunostained for podocalyxin and VCAM-1 (E) or ICAM-1 (f). Mean fluorescence intensity of VCAM-1 (e) and ICAM-1 (f) was measured on the whole spinal cord section and on the podocalyxin+ segemented vessels. Data are pooled from 3 independent experiments representing 3 mice per condition. Data are shown as mean ± SD and were analyzed using ordinary one-way ANOVA with Tukey’s multiple comparisons test. g) Crawling speed (µm/min) of recirculating in vivo activated tdTomato+ OT-I cells injected 24 h prior to LCMV-OVA infection in WT C57BL/6J (green), ODC-OVA; JAM-BWT (white) and ODC-OVA; JAM-BKO (blue) mice at day 7 after LCMV-OVA infection. Bar graphs summarize data from 670 OT-I cells from 6 WT mice, 1259 OT-I cells from 6 ODC-OVA; JAM-BWT mice and 174 OT-I cells from 3 ODC-OVA; JAM-BKO mice. Data were analysed using two-sided parametric T test. h) Crawling speed (µm/minute) of in vitro activated P14 and OT-I cells within cervical spinal cord microvessels of ODC-OVA; JAM-BWT and ODC-OVA; JAM-BKO mice on day 7 after LCMV-OVA infection. Prior to the intravital imaging, in vitro activated P14 and OT-I cells were injected into the circulation. Bar graphs summarize data from 50 cells pooled from 4 different mice per condition. Data were analysed using two-sided parametric T test. DV = dorsal vein
Fig. 7
Fig. 7
Jam2 expression in the CNS. (a-e)Jam2 RNAscope in situ hybridization (magenta) on 10 μm thick brain and spinal cord sections from healthy ODC-OVA; JAM-BWT mice (a-c, e) and from C57BL/6J mice suffering from EAE at the peak of inflammation (d) co-immunostained for podocalyxin (red) and GFAP (green). Nuclei (DAPI) are shown in blue. Representative maximum intensity projection images from the cortical surface of the brain (a), the lateral ventricle choroid plexus (b), the spinal cord (c-d) and the cerebellar cortex (e). Data are representative of 3 healthy ODC-OVA; JAM-BWT mice and 1 C57BL/6J mouse suffering from EAE. f)Jam2 RNAscope in situ hybridization (yellow) on 10 μm thick cerebellum cryosections from ODC-OVA; JAM-BWT mice coimmunostained for calbindin (red) as a Purkinje cell marker. Data are representative of 3 independent experiments from 3 mice
Fig. 8
Fig. 8
CD8 T cells get trapped at the CNS borders in the absence of JAM-B during neuroinflammation. Naive tdTomato+ OT-I cells were adoptively transfered into ODC-OVA; JAM-BWT and ODC-OVA; JAM-BKO mice one day prior to LCMV-OVA infection. a-c) Brains from ODC-OVA; JAM-BWT and ODC-OVA; JAM-BKO mice were harvested on day 7 after LCMV-OVA infection. Immunofluorescence staining for pan-laminin (white) was performed on 20 μm thick brain cryosections. tdTomato+ OT-I cells are shown in red and nuclei were stained with DAPI (blue). a) Representative optical sections (1 μm thick) are shown in the three left panels. Maximum intensity projections (MIP) are shown on the right panel. Data is representative of 5 different mice per condition. (b) Percentage of OT-I cells found intravascular, perivascular and parenchymal per vessel with a visible perivascular space from ODC-OVA; JAM-BWT (white) and ODC-OVA; JAM-BKO (blue) mouse brains on day 7 after LCMV-OVA infection. Violin plots show the distribution of the pooled data from 78 vessels from 3 ODC-OVA; JAM-BWT mice and 110 vessels from 5 ODC-OVA; JAM-BKO mice. Each dot represent the mean percentage per mouse and each color represent an individual mouse. Data were analysed comparing the mean values per mouse and using an ordinary two-way ANOVA with Šídàk’s multiple comparisons test. (c) Total number of intravascular, perivascular and parenchymal OT-I cells per vessel analyzed in e. Each dot represents the mean value per mouse and the colors correspond to the individual mice represented in e. bar graphs represent the mean ± SD. Data were analysed using a two-sided parametric T test

References

    1. Abadier M, Haghayegh Jahromi N, Cardoso Alves L, Boscacci R, Vestweber D, Barnum S, Deutsch U, Engelhardt B, Lyck R (2015) Cell surface levels of endothelial ICAM-1 influence the transcellular or paracellular T-cell diapedesis across the blood-brain barrier. European Journal of Immunology, City, pp 1043–1058 - PubMed
    1. Agrawal S, Anderson P, Durbeej M, van Rooijen N, Ivars F, Opdenakker G, Sorokin LM (2006) Dystroglycan is selectively cleaved at the parenchymal basement membrane at sites of leukocyte extravasation in experimental autoimmune encephalomyelitis. J Exp Med 203:1007–1019. 10.1084/jem.20051342 - PMC - PubMed
    1. Amatruda M, Chapouly C, Woo V, Safavi F, Zhang J, Dai D, Therattil A, Moon C, Villavicencio J Gordon A, Parkos C, Horng, S(2022) Astrocytic junctional adhesion molecule-A regulates T-cell entry past the glia limitans to promote central nervous system autoimmune attack. Brain Communications, Feb 18;4(2):fcac044. doi: 10.1093/braincomms/fcac044. eCollection 2022. - PMC - PubMed
    1. Arcangeli ML, Frontera V, Bardin F, Obrados E, Adams S, Chabannon C, Schiff C, Mancini SJC, Adams RH, Aurrand-Lions M (2011) JAM-B regulates maintenance of hematopoietic stem cells in the bone marrow. Blood. © 2011 by The American Society of Hematology, City, pp 4609–4619 - PubMed
    1. Arrate MP, Rodriguez JM, Tran TM, Brock TA, Cunningham SA (2001) Cloning of Human Junctional Adhesion Molecule 3 (JAM3) and Its Identification as the JAM2 Counter-receptor. Journal of Biological Chemistry. © 2001 ASBMB. Currently published by Elsevier Inc; originally published by American Society for Biochemistry and Molecular Biology., City, pp 45826–45832 - PubMed

Publication types

MeSH terms

Substances