Observational Study
. 2025 May 12:16:1594296.
doi: 10.3389/fimmu.2025.1594296. eCollection 2025.

Distinct immunity dynamics of natural killer cells in mild and moderate COVID-19 cases during the Omicron variant phase

Affiliations
Observational Study

Distinct immunity dynamics of natural killer cells in mild and moderate COVID-19 cases during the Omicron variant phase

Yukari Nishikawa et al. Front Immunol. .

Abstract

Background: The SARS-CoV-2 Omicron variant is associated with milder COVID-19 symptoms than previous strains. This study analyzed alterations in natural killer (NK) cell-associated immunity dynamics in mild and moderate COVID-19 cases during the Omicron phase of the COVID-19 pandemic.

Methods: We conducted a retrospective observational cohort study of patients aged ≥16 with confirmed SARS-CoV-2 infection who were hospitalized at Tottori University Hospital between January 2022 and May 2022. A total of 27 patients were included in the analysis. Of these, 11 and 16 were diagnosed with mild and moderate COVID-19, respectively, based on the Japanese COVID-19 clinical practice guideline. Peripheral blood NK cell subsets and surface markers, including the activating receptor NKG2D and the inhibitory receptor TIGIT, as well as serum levels of 24 immunoregulatory markers, such as cytokines and cytotoxic mediators, were measured at admission and recovery. In addition, to explore immune patterns associated with disease severity, differences in 24 serum markers and soluble UL16-binding protein 2 (sULBP2) at the clinically most symptomatic time point during hospitalization were visualized using a volcano plot and analyzed with Spearman's rank correlation analysis and principal component analysis (PCA).

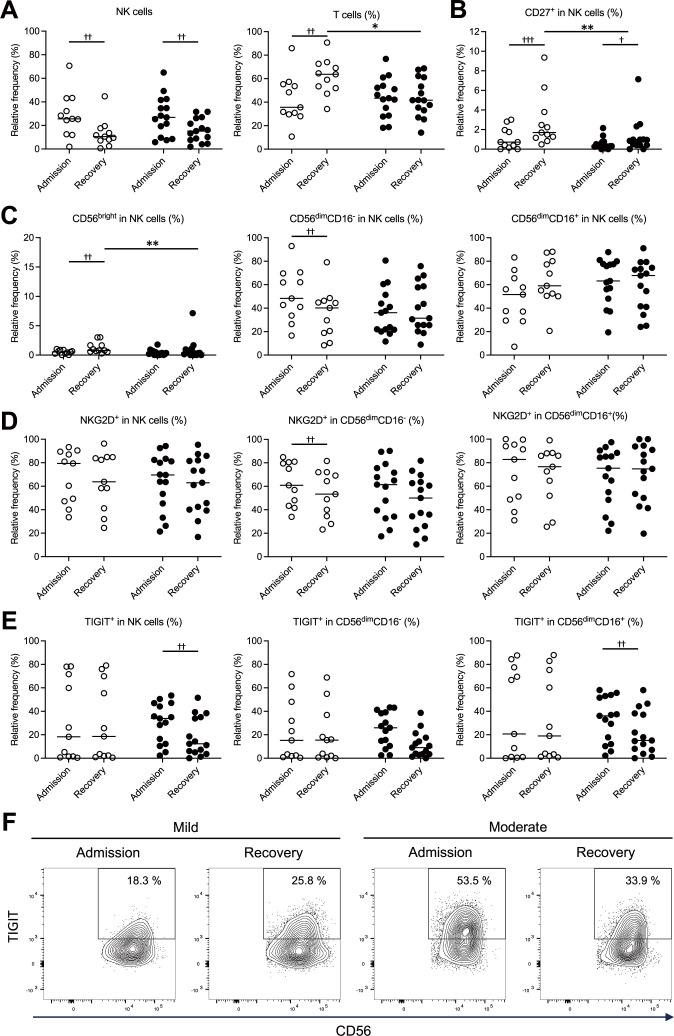
Results: Patients with mild COVID-19 exhibited expanded subsets of unconventional CD56dimCD16- NK cells with elevated NKG2D expression and lower levels of cytotoxic mediators (granzyme A, granzyme B, and granulysin). In contrast, patients with moderate disease exhibited NK cell exhaustion, characterized by upregulation of TIGIT, along with increased levels of NK cell-associated cytokines and cytotoxic mediators. The volcano plot identified that the patients with moderate COVID-19 exhibited significantly elevated IL-6 and sULBP2 levels. Spearman's rank correlation analysis revealed that IL-6, IFN-γ, soluble Fas, and CXCL8 were correlated with increased sULBP2. The PCA identified distinct clusters based on disease severity.

Conclusions: The results of study highlight the differences in NK cell-associated immune alterations between mild and moderate COVID-19 cases. Elevated IL-6 and sULBP2 levels, along with their correlations with inflammatory mediators, reflects differences in immune response based on disease severity. These findings provide insight into the immune response to infection caused by the Omicron variant of SARS-CoV-2 and improve our understanding of its immunological features.

Keywords: COVID-19; NKG2D; Omicron variant; TIGIT; ULBP2; cytokines; disease severity; natural killer cells.


Conflict of interest statement

The authors declare that the research was conducted in the absence of any commercial or financial relationships that could be construed as a potential conflict of interest.

Figures

Figure 1
Figure 1
Comparison of laboratory parameters measured at the time of admission between the mild and moderate COVID-19 groups. The data on white blood cell count, the ratio of neutrophils and lymphocytes, viral load, erythrocyte sedimentation rate (ESR), and C-reactive protein (CRP), lactate dehydrogenase (LDH), d-dimer, and ferritin levels were extracted from the medical records of the patients in the mild (n = 11) and moderate (n = 16) groups. Extraction of the data extracted from electronic medical records limited the sample size. The median values were compared using the Mann–Whitney test. The white circles and black circles represent individual patient values for the mild group and moderate group, respectively. The horizontal bars indicate the median values. P values are indicated as follows: *p < 0.05, **p < 0.01, ***p < 0.001. Non-significant differences are not marked.
Figure 2
Figure 2
Temporal changes in NK cell subsets and expression profiles of NKG2D and TIGIT in the mild and moderate COVID-19 groups. NK cell profiles measured at the time of admission and during recovery were compared between the mild (n = 11) and moderate (n = 15) groups, highlighting differences associated with disease severity. (A) Proportions of NK cells (CD3-CD56+) and T cells (CD3+CD56-) within peripheral blood mononuclear cells (PBMCs). (B) Proportions of CD27+ cells in NK cells. (C) Proportions of NK cell subsets (CD56bright, CD56dimCD16-, CD56dimCD16+) in NK cells. (D) Proportions of all the NK cells and their subsets (CD56dimCD16-, CD56dimCD16+) expressing NKG2D on the cell surface. (E) Proportions of all the NK cells and their subsets (CD56dimCD16-, CD56dimCD16+) expressing TIGIT on the cell surface. (F) Representative counter plots corresponding to the data in (E), illustrating the proportions of TIGIT-expressing cells among all the NK cells. In (A–E), the white and black circles represent individual patient data for the mild group and the moderate group, respectively, and the horizontal bars indicate median values. The Wilcoxon signed-rank test was used for comparisons between the admission and recovery phases, and the Mann–Whitney U test for comparisons between disease severity groups. Significance levels were set as follows: †p < 0.05, ††p < 0.01, †††p < 0.001 for the Wilcoxon signed-rank test, *p < 0.05, **p < 0.01, for the Mann–Whitney U test. Non-significant differences are not marked.
Figure 3
Figure 3
Relationship between TIGIT and NKG2D expression in NK cells in patients with mild and moderate COVID-19. Flow cytometry of PBMCs was performed to generate two-dimensional plots of TIGIT and NKG2D expression on NK cells (CD3-CD56+). The proportions of TIGIT-NKG2D+, TIGIT+NKG2D+, and TIGIT+NKG2D- cells at the time of admission and during recovery were compared between patients in the mild (n = 11) and moderate (n = 15) groups, highlighting differences related to disease severity. (A) Representative contour plots of the total NK cells, with TIGIT on the x-axis and NKG2D on the y-axis. (B–D) Proportions of TIGIT-NKG2D+, TIGIT+NKG2D+, TIGIT+NKG2D- cells among all the NK cells (B), the CD56dimCD16- NK cell subset (C), and the CD56dimCD16+ NK cell subset (D). In (B–D), the white circles and black circles represent individual patient data for the mild group and moderate group, respectively, and the horizontal bars indicate median values. The Wilcoxon signed-rank test was used for comparisons between the admission and recovery phases, and the Mann–Whitney U test for comparisons between disease severity group. Significance levels were set as follows: †p < 0.05, ††p < 0.01, †††p < 0.001 for the Wilcoxon signed-rank test, *p < 0.05 for the Mann–Whitney U test. Non-significant differences are not marked.
Figure 4
Figure 4
Cytokine and cytotoxic mediator profiles of NK cell-mediated immunity during mild and moderate COVID-19. Serum levels of 15 NK cell-related cytokines and cytotoxic mediators at the time of admission and during recovery were compared between the mild (n = 11) and moderate (n = 16) groups, highlighting differences related to disease severity. The white circles and black circles represent individual patient data for the mild group and moderate group, respectively, and the horizontal bars indicate median values. Wilcoxon signed-rank test was used for comparisons between the admission and recovery phases, and the Mann–Whitney U test for comparisons between disease severity groups. Significance levels were set as follows: †p < 0.05, ††p < 0.01, †††p < 0.001 for the Wilcoxon signed-rank test, *p < 0.05, **p < 0.01, ****p < 0.0001 for the Mann–Whitney U test. Non-significant differences are not marked.
Figure 5
Figure 5
Elevated sULBP2 levels in patients with moderate COVID-19. (A) Serum levels of sULBP2 at the clinically most symptomatic time point during hospitalization were measured in the mild (n = 11) and moderate (n = 16) groups using the Human ULBP2 SimpleStep ELISA® Kit. White circles and black circles represent individual patient values for the mild group and moderate group, respectively. Horizontal bars indicate the mean values. Statistical significance is denoted as **p < 0.01. (B) A volcano plot generated to compare the mild and moderate cases at the clinically most symptomatic time point using the levels of 24 serum markers and sULBP2. The y-axis represents −log10 (q-value), whereas the x-axis represents log2 fold change (FC), where FC is defined as the mean value in moderate cases divided by the mean value in mild cases. The dashed line represents nominal p = 0.05, indicating that serum markers above the line are significant without multiple comparison correction. Statistical analyses were conducted using the Mann–Whitney U test for comparisons between disease severity group. White squares indicate that the serum markers the remained significant after false discovery rate (FDR) correction performed using the two-stage linear step-up procedure of Benjamini, Krieger, and Yekutieli, whereas the black squares indicate those that were not significant. A threshold of q < 0.05 was considered statistically significant.
Figure 6
Figure 6
Correlations among cytokines, cytotoxic mediators, and sULBP2 in COVID-19 cases. (A-C) Correlation analysis of the serum levels of 24 cytokines, cytotoxic mediators, and soluble marker, along with sULBP2, at the clinically most symptomatic time point during hospitalization in mild (n = 11) and moderate (n = 16) cases. (A) Heatmap displaying Spearman’s rank correlation coefficients (Spearman-r). (B) Dot plot displaying Spearman’s correlation coefficients and their 95% confidence intervals for the correlations between sULBP2 and the 24 factors. (C) Four separate XY scatter plots, showing the relationships between sULBP2 concentrations (x-axis) and IL-6, IFN-γ, sFas, and CXCL8 (IL-8) concentrations (y-axis). These four factors were selected based on the coefficients of their correlations with sULBP2, which were greater than 0.5, as identified in (A). Each plot includes a single linear regression line (solid line) with 95% confidence intervals represented by dashed lines. (D–E) Principal component analysis (PCA). (D) Loading plot showing the contributions of each factor to the principal components. (E) PCA scatter plot of PC-1 versus PC-2. Blue circles represent individual patients in the mild group. Red circles represent patients in the moderate group with higher sULBP2 levels (> 200 pg/mL), and green circles represent patients in the moderate group with lower sULBP2 levels (< 200 pg/mL).
Figure 7
Figure 7
Conceptual figure of the thesis of this research. (A) In the patients with mild COVID-19, CD56dimCD16- NK cells may exhibit lower cytotoxic activity than the more mature CD56dimCD16+ NK cells. (B) During the acute phase of moderate COVID-19, inflammatory cytokine elevation and increased expression of molecules that activate NK cell function occur simultaneously. (C) NK cell exhaustion in moderate cases following NK cell activation. Both CD56dimCD16- and CD56dimCD16+ subsets exhibited upregulated expression of the inhibitory receptor TIGIT, with some cells also showing concurrent upregulation of the activating receptor NKG2D.

Similar articles

Cited by

  • NK Cells: A Powerful Squad Versus SARS-CoV-2.
    Alvarado-Hernández DL, Noyola MV, Martínez-Rider R, Bernal-Silva S, Comas-Garcia A. Alvarado-Hernández DL, et al. Int J Mol Sci. 2025 Jul 6;26(13):6500. doi: 10.3390/ijms26136500. Int J Mol Sci. 2025. PMID: 40650276 Free PMC article. Review.

References

    1. Adil MT, Rahman R, Whitelaw D, Jain V, Al-Taan O, Rashid F, et al. . SARS-coV-2 and the pandemic of COVID-19. Postgrad Med J. (2021) 97:110–6. doi: 10.1136/postgradmedj-2020-138386 - DOI - PMC - PubMed
    1. Sarker R, Roknuzzaman ASM, Nazmunnahar, Hossain MJ, Islam MR. Benefits and probable ill effects of WHO’s declaration of end of COVID-19 pandemic: a way back to pandemic-free normal life. Ann Med Surg (Lond). (2023) 85:3199–201. doi: 10.1097/ms9.0000000000000848 - DOI - PMC - PubMed
    1. Yeates EO, Nahmias J, Chinn J, Sullivan B, Stopenski S, Amin AN, et al. . Improved outcomes over time for adult COVID-19 patients with acute respiratory distress syndrome or acute respiratory failure. PloS One. (2021) 16:e0253767. doi: 10.1371/journal.pone.0253767 - DOI - PMC - PubMed
    1. Wolter N, Jassat W, Walaza S, Welch R, Moultrie H, Groome M, et al. . Early assessment of the clinical severity of the SARS-CoV-2 omicron variant in South Africa: a data linkage study. Lancet. (2022) 399:437–46. doi: 10.1016/s0140-6736(22)00017-4 - DOI - PMC - PubMed
    1. Zafarani A, Razizadeh MH, Pashangzadeh S, Amirzargar MR, Taghavi-Farahabadi M, Mahmoudi M. Natural killer cells in COVID-19: from infection, to vaccination and therapy. Future Virol. (2023) 18:177–91. doi: 10.2217/fvl-2022-0040 - DOI - PMC - PubMed

Publication types

Supplementary concepts