Review
. 2025 Apr 24:36:100573.
doi: 10.1016/j.lansea.2025.100573. eCollection 2025 May.

Preconception malnutrition among women and girls in south Asia: prevalence, determinants, and association with pregnancy and birth outcomes

Affiliations
Review

Preconception malnutrition among women and girls in south Asia: prevalence, determinants, and association with pregnancy and birth outcomes

Faith Miller et al. Lancet Reg Health Southeast Asia. .

Abstract

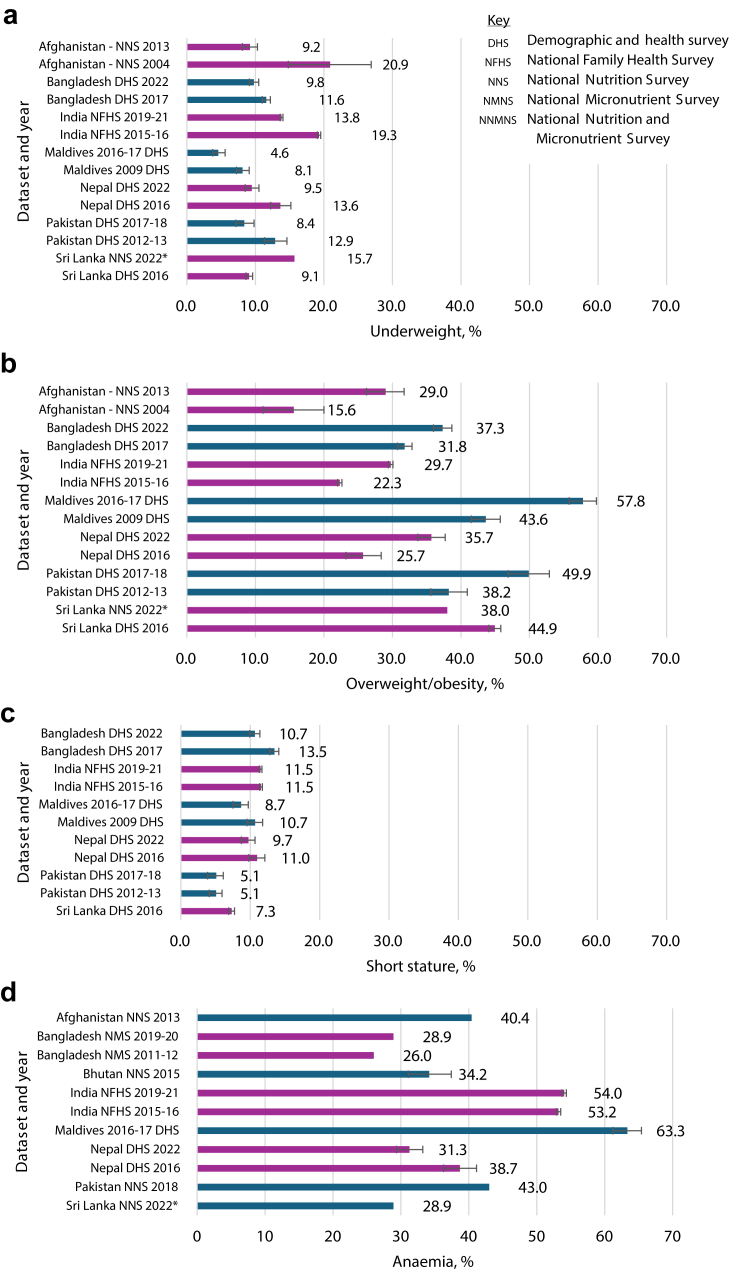
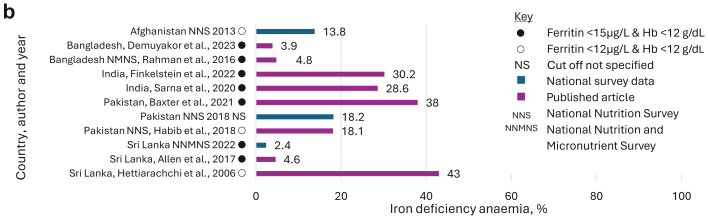
This review highlights the growing double burden of malnutrition among women of reproductive age in South Asia. Using nationally-representative survey data, we highlight that the prevalence of overweight now exceeds that of underweight, while anaemia remains persistently high despite intervention efforts. Underweight and anaemia are more common among unmarried women, whereas overweight is more prevalent among parous women, underscoring the need for life-stage-specific preconception nutrition programs. In our systematic review, micronutrient deficiencies vary widely between and within countries, reflecting regional disparities in nutritional status and inconsistencies in diagnostic methods. Associations of preconception underweight, overweight, anaemia and micronutrient deficiencies with health, nutrition, socio-demographic, and WASH indicators are mixed, emphasising the need for tailored, context-specific interventions. The lack of longitudinal studies limits our understanding of associations between preconception nutritional status and subsequent birth outcomes, underscoring the need for comprehensive, longitudinal studies across South Asia to inform and monitor targeted nutrition programs.

Keywords: Adolescent; Anaemia; Demographic and health survey; Micronutrient; Nutrition; Overweight; Preconception; Pregnancy planning; Review; Underweight.


Conflict of interest statement

Co-authors VS and ZM are employees of UNICEF Regional Office for south Asia (RoSA) which funded this study. Other authors have no conflicts of interest. DS is supported by the National Institute for Health and Care Research (NIHR) through an NIHR Advanced Fellowship (NIHR302955) and the NIHR Southampton Biomedical Research Centre (NIHR203319). The authors declare no other conflicts of interest.

Figures

Fig. 1
Fig. 1
Conceptual framework organising individual, household, and contextual determinants for preconception health, updated from Partap et al.‘s systematic review.
Fig. 2
Fig. 2
Prevalence of underweight, overweight, short stature, and anaemia among married∗∗ women from nationally-representative surveys, organised by country and year of publication. a) Underweight prevalence, b) Overweight/obesity prevalence, c) Short-stature prevalence, d) Anaemia prevalence. DHS, demographic and health survey; NFHS, National Family Health Survey; NNS, National nutrition survey; NMNS, National micronutrient survey; NNMNS, National nutrition and micronutrient survey. Error bars represent 95% confidence intervals. ∗Sri Lanka NNS 2022 age range 18–40, other countres 15–49. ∗∗Afghanistan 2013 does include unmarried women, and reports for Afghanistan NNS 2004, Bangladesh NNS 2011–12 or 2018–19, Pakistan NNS 2018 or Sri Lanka NNS 2022 do not report whether estimates include unmarried women or not. Underweight BMI<18.5 kg/m2, Overweight/obesity BMI ≥ 25 kg/m2, short stature <145 cm, anaemia Hb < 12 g/d.
Fig. 3
Fig. 3
Anaemia prevalence as reported by the included studies and from nationally-representative surveys where available, organised by country and year of publication. a) Anaemia prevalence: Ba, Bangladesh; BFW, breast-feeding women; Bh, Bhutan; DHS, demographic and health survey; In, India; Ma, The Maldives; MND, Micronutrient deficiency cohort; Ne, Nepal; NFHS, National Family Health Survey; NNS, National nutrition survey; NMNS, National micronutrient survey; NNMNS, National nutrition and micronutrient survey; NPNBFW, Non-pregnant non-breast-feeding women; Pa, Pakistan; SL, Sri Lanka; WRA, women of reproductive age. Blood type specified in label: C; capillary blood, V; venous blood, NS; blood type not specified. For graphs presenting anaemia prevalence by blood type, refer to Supplementary File 9. Anaemia generally determined using serum haemoglobin (Hb) concentrations or haematocrit. ∗Hb cut-off <12 g/dL, or <10 g/dL in one study—Shinde et al., 2021 (indicated by a lighter coloured bar with border). For studies including girls aged 10–11 years a cut-off of <11.5 g/dL was used for these participants., , , , Error bars represent 95% confidence interval for DHS/NFHS data, or standard deviation where reported by the included studies. Blue bars represent data from nationally-representative surveys, whereas purple bars represent estimates from published studies. b) Iron-deficiency anaemia prevalence: IDA, iron-deficiency anaemia; NNS, National nutrition survey; NNMNS, National nutrition and micronutrient survey. IDA estimated from combined low Hb and ferritin: Hb < 12 g/d and ferritin <15 (●) or <12 μg/L (○). Blue bars represent data from nationally-representative surveys, whereas purple bars represent estimates from published studies.
Fig. 3
Fig. 3
Anaemia prevalence as reported by the included studies and from nationally-representative surveys where available, organised by country and year of publication. a) Anaemia prevalence: Ba, Bangladesh; BFW, breast-feeding women; Bh, Bhutan; DHS, demographic and health survey; In, India; Ma, The Maldives; MND, Micronutrient deficiency cohort; Ne, Nepal; NFHS, National Family Health Survey; NNS, National nutrition survey; NMNS, National micronutrient survey; NNMNS, National nutrition and micronutrient survey; NPNBFW, Non-pregnant non-breast-feeding women; Pa, Pakistan; SL, Sri Lanka; WRA, women of reproductive age. Blood type specified in label: C; capillary blood, V; venous blood, NS; blood type not specified. For graphs presenting anaemia prevalence by blood type, refer to Supplementary File 9. Anaemia generally determined using serum haemoglobin (Hb) concentrations or haematocrit. ∗Hb cut-off <12 g/dL, or <10 g/dL in one study—Shinde et al., 2021 (indicated by a lighter coloured bar with border). For studies including girls aged 10–11 years a cut-off of <11.5 g/dL was used for these participants., , , , Error bars represent 95% confidence interval for DHS/NFHS data, or standard deviation where reported by the included studies. Blue bars represent data from nationally-representative surveys, whereas purple bars represent estimates from published studies. b) Iron-deficiency anaemia prevalence: IDA, iron-deficiency anaemia; NNS, National nutrition survey; NNMNS, National nutrition and micronutrient survey. IDA estimated from combined low Hb and ferritin: Hb < 12 g/d and ferritin <15 (●) or <12 μg/L (○). Blue bars represent data from nationally-representative surveys, whereas purple bars represent estimates from published studies.
Fig. 4
Fig. 4
Prevalence of micronutrient deficiencies, as reported by the included studies, organised by country and year of publication. a) Iron deficiency determined using serum ferritin <15# or <12∗ μg/L, NS: cut-off not specified. NNS, National nutrition survey; NMNS, National micronutrient survey; NNMNS, National nutrition and micronutrient survey. Blue bars represent data from nationally-representative surveys, whereas purple bars represent estimates from published studies. b) Folate deficiency determined as serum folate <6.7–7 nmoL/l∗ or <10 nmoL/l∗∗, or RBC folate 151 ng/mL (342 nmol/L; conversion factor: 2.266)# or <748 nmol/L##, NS: cut-off not specified. NNS; National nutrition survey, NMNS; National micronutrient survey. Blue bars represent data from nationally-representative surveys, whereas purple or green bars represent estimates from published studies. c) Vitamin A deficiency cut-off: <0.7 μmoL/l, apart from three studies using <0.64 μmol/L∗, <1.05 mmoL/l∗∗, or <20 μg/dL∗∗∗. NNS, National nutrition survey; NMNS, National micronutrient survey. Blue bars represent data from nationally-representative surveys, whereas purple bars represent estimates from published studies. d) Zinc deficiency cut-offs included <10.1 μmoL/l∗ (<10.7 μmol/L fasting), <60 μg/dL∗∗, <80 μg/dl∗∗∗, <9.3–11.3 μmol/L# (depending on time of day and fasting status), <66–74 μg/dl ## (depending on time of day and fasting status), <59–66 μg/dL ### (depending on time of day and fasting status), and <9.95 μmol/L (<650 μg/L) ####. NS: cut-off not specified. NNS, National nutrition survey; NMNS, National micronutrient survey. Blue bars represent data from nationally-representative surveys, whereas purple bars represent estimates from published studies. e) B12 mostly deficiency defined as <150 pmol/L (equivalent to <203 pg/mL), or <148 pmol/L∗, NS: cut-off not specified. NNS; National nutrition survey, NMNS; National micronutrient survey. Blue bars represent data from nationally-representative surveys, whereas purple bars represent estimates from published studies. f) BFW, breast-feeding women; In, India; NPNBFW, Non-pregnant non-breast-feeding women. Iodine deficiency: urinary iodine concentration <100 mg/L∗, <50 μg/L∗∗, or <15 ppm#, NS: cut-off not specified. NNS, National nutrition survey; NMNS, National micronutrient survey; NNMNS, National nutrition and micronutrient survey; NPNBFW, Non-pregnant non-breast-feeding women. Blue bars represent data from nationally-representative surveys, whereas purple bars represent estimates from published studies. g) Vitamin D deficiency was defined serum 25(OH)D <20 ng/mL (equivalent to 50 nmoL/l)∗ or <25 ng/mL∗∗ (cut-off missing from one paper∗∗∗), NS, cut-off not specified; NNS, National nutrition survey; NMNS, National micronutrient survey. Blue bars represent data from nationally-representative surveys, whereas purple bars represent estimates from published studies.
Fig. 4
Fig. 4
Prevalence of micronutrient deficiencies, as reported by the included studies, organised by country and year of publication. a) Iron deficiency determined using serum ferritin <15# or <12∗ μg/L, NS: cut-off not specified. NNS, National nutrition survey; NMNS, National micronutrient survey; NNMNS, National nutrition and micronutrient survey. Blue bars represent data from nationally-representative surveys, whereas purple bars represent estimates from published studies. b) Folate deficiency determined as serum folate <6.7–7 nmoL/l∗ or <10 nmoL/l∗∗, or RBC folate 151 ng/mL (342 nmol/L; conversion factor: 2.266)# or <748 nmol/L##, NS: cut-off not specified. NNS; National nutrition survey, NMNS; National micronutrient survey. Blue bars represent data from nationally-representative surveys, whereas purple or green bars represent estimates from published studies. c) Vitamin A deficiency cut-off: <0.7 μmoL/l, apart from three studies using <0.64 μmol/L∗, <1.05 mmoL/l∗∗, or <20 μg/dL∗∗∗. NNS, National nutrition survey; NMNS, National micronutrient survey. Blue bars represent data from nationally-representative surveys, whereas purple bars represent estimates from published studies. d) Zinc deficiency cut-offs included <10.1 μmoL/l∗ (<10.7 μmol/L fasting), <60 μg/dL∗∗, <80 μg/dl∗∗∗, <9.3–11.3 μmol/L# (depending on time of day and fasting status), <66–74 μg/dl ## (depending on time of day and fasting status), <59–66 μg/dL ### (depending on time of day and fasting status), and <9.95 μmol/L (<650 μg/L) ####. NS: cut-off not specified. NNS, National nutrition survey; NMNS, National micronutrient survey. Blue bars represent data from nationally-representative surveys, whereas purple bars represent estimates from published studies. e) B12 mostly deficiency defined as <150 pmol/L (equivalent to <203 pg/mL), or <148 pmol/L∗, NS: cut-off not specified. NNS; National nutrition survey, NMNS; National micronutrient survey. Blue bars represent data from nationally-representative surveys, whereas purple bars represent estimates from published studies. f) BFW, breast-feeding women; In, India; NPNBFW, Non-pregnant non-breast-feeding women. Iodine deficiency: urinary iodine concentration <100 mg/L∗, <50 μg/L∗∗, or <15 ppm#, NS: cut-off not specified. NNS, National nutrition survey; NMNS, National micronutrient survey; NNMNS, National nutrition and micronutrient survey; NPNBFW, Non-pregnant non-breast-feeding women. Blue bars represent data from nationally-representative surveys, whereas purple bars represent estimates from published studies. g) Vitamin D deficiency was defined serum 25(OH)D <20 ng/mL (equivalent to 50 nmoL/l)∗ or <25 ng/mL∗∗ (cut-off missing from one paper∗∗∗), NS, cut-off not specified; NNS, National nutrition survey; NMNS, National micronutrient survey. Blue bars represent data from nationally-representative surveys, whereas purple bars represent estimates from published studies.

Similar articles

References

    1. UNICEF . 2023. Undernourished and overlooked: a global nutrition crisis in adolescent girls and women. New York.
    1. Ferdausi F., Al-Zubayer M.A., Keramat S.A., Ahammed B. Prevalence and associated factors of underweight and overweight/obesity among reproductive-aged women: a pooled analysis of data from South Asian countries (Bangladesh, Maldives, Nepal and Pakistan) Diabetes Metab Syndr. 2022;16 doi: 10.1016/j.dsx.2022.102428. - DOI - PubMed
    1. Stevens G.A., Beal T., Mbuya M.N.N., et al. Micronutrient deficiencies among preschool-aged children and women of reproductive age worldwide: a pooled analysis of individual-level data from population-representative surveys. Lancet Glob Health. 2022;10:e1590–e1599. doi: 10.1016/S2214-109X(22)00367-9. - DOI - PMC - PubMed
    1. Sarna A., Porwal A., Ramesh S., et al. Characterisation of the types of anaemia prevalent among children and adolescents aged 1-19 years in India: a population-based study. Lancet Child Adolesc Health. 2020;4:515–525. doi: 10.1016/S2352-4642(20)30094-8. - DOI - PubMed
    1. Scarmeas N., Anastasiou C.A., Yannakoulia M. Nutrition and prevention of cognitive impairment. Lancet Neurol. 2018;17:1006–1015. doi: 10.1016/S1474-4422(18)30338-7. - DOI - PubMed

LinkOut - more resources