. 2025 May 3:52:291-300.
doi: 10.1016/j.jot.2025.04.012. eCollection 2025 May.

Solute transport from synovial fluid to articular cartilage and subchondral bone at different stages of osteoarthritis in a live mouse model

Affiliations

Solute transport from synovial fluid to articular cartilage and subchondral bone at different stages of osteoarthritis in a live mouse model

Mengcun Chen et al. J Orthop Translat. .

Abstract

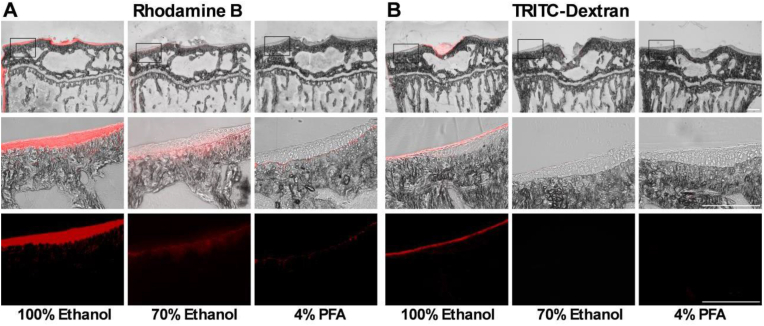
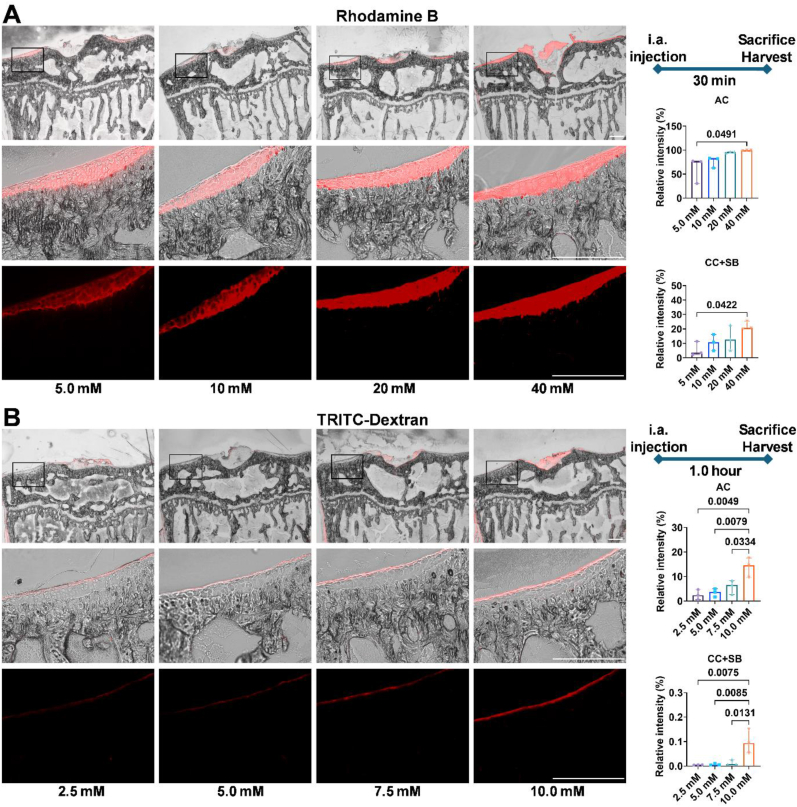
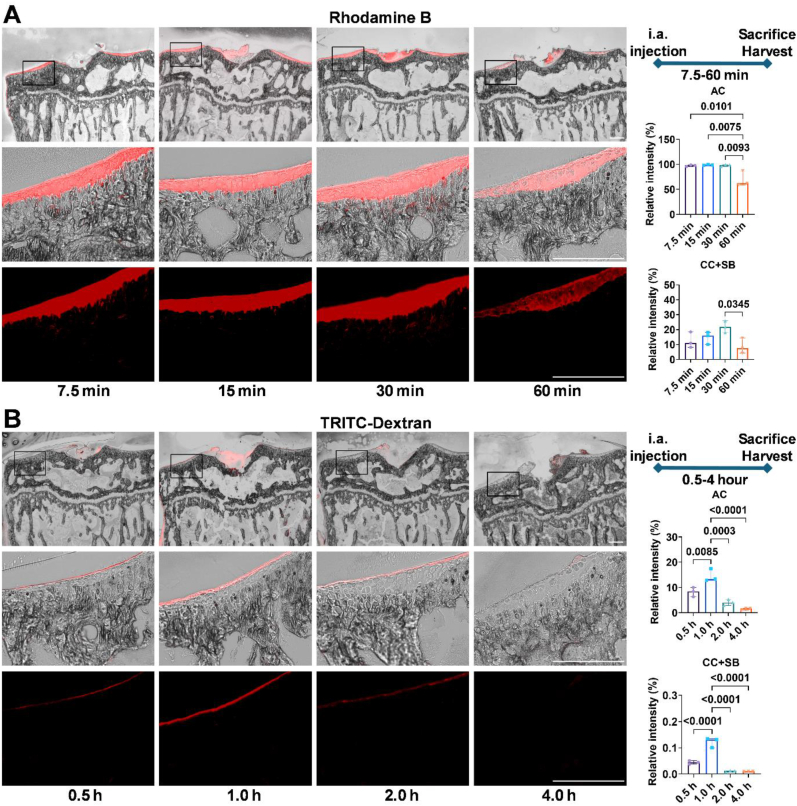
Objective: This study aims to (1) identify a simplified method to preserve sample integrity and maintain original fluorescence distribution; (2) assess the diffusivity of small and large molecules within articular cartilage (AC), calcified cartilage (CC), and subchondral bone (SB); and (3) investigate the changes in solute transport at various stages of osteoarthritis (OA) in a destabilization of the medial meniscus (DMM) murine model.

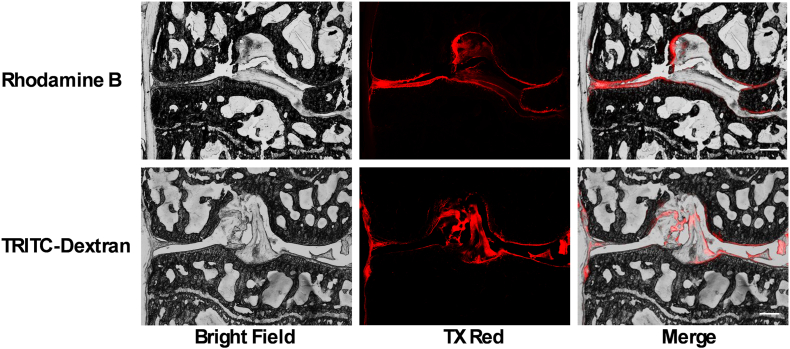
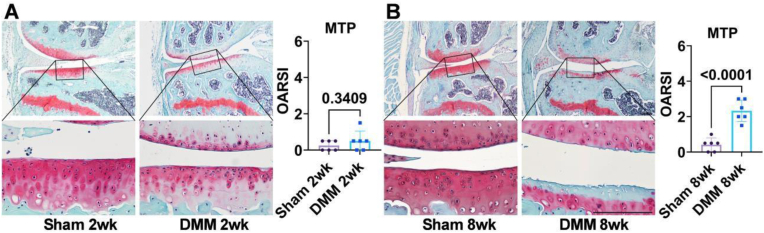
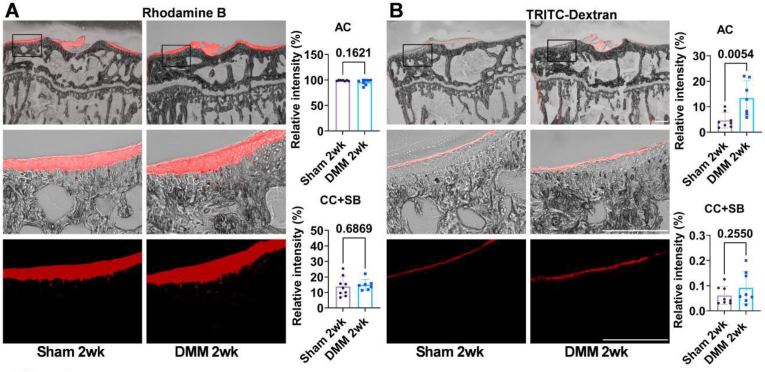
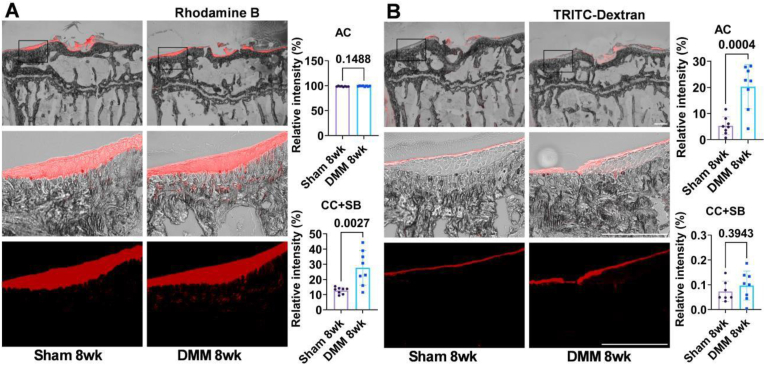
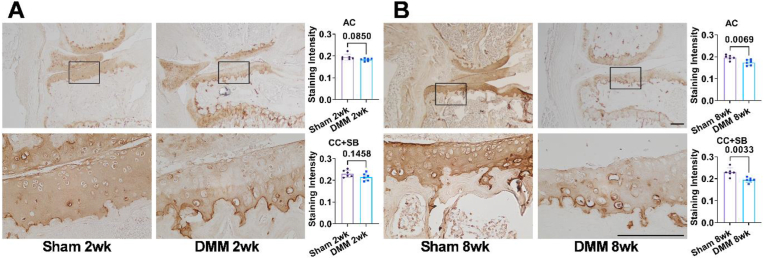
Methods: Fluorescent dyes of small and large molecules were injected into the knee joints of live mice. Joints were harvested and rapidly frozen immediately post-euthanasia. Optimal dye concentrations and dwelling times were determined through exploratory studies. Mice underwent either DMM or sham surgery and were evaluated at 2 and 8 weeks postoperatively. Relative fluorescence intensity was quantified within the AC, CC and SB, complemented by micro-CT, safranin O staining, and collagen II immunohistochemistry staining.

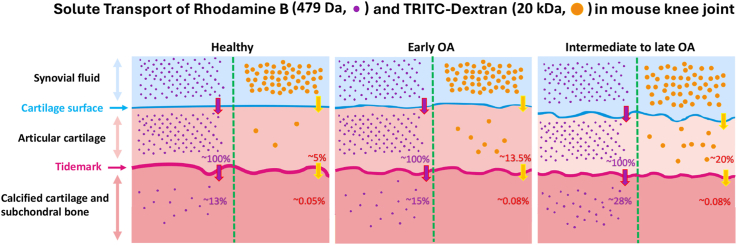
Results: The methodology successfully preserved sample integrity and original dye distribution. Fluorescent imaging revealed that small solute was mainly restricted by the tidemark, while large solute showed limited permeability in AC. Permeability of AC remained elevated in the DMM group at both time points. Increased permeability in CC and SB was observed only at 8 weeks post-DMM surgery, accompanied by reduced collagen II amount.

Conclusions: In live mice, the tidemark serves as a barrier to small molecule diffusion, while the cartilage surface restricts larger molecules; however, both structures exhibit increased permeability in OA. These findings advance the understanding of OA pathogenesis and suggest potential therapeutic targets related to cartilage permeability.

Translational potential: The findings of this study advance the understanding of osteoarthritis pathogenesis by elucidating the role of solute transport alterations in cartilage and subchondral bone, thereby suggesting potential therapeutic targets aimed at modulating cartilage permeability to improve joint health in osteoarthritis.

Keywords: Articular cartilage; Calcified cartilage; Fluorescent dye; Osteoarthritis; Permeability; Subchondral bone.


Figures

Image 1
Solute transport from synovial fluid to articular cartilage and subchondral bone at different stages of osteoarthritis in a live mouse model.
Fig. 1
Fig. 1
Distribution of fluorescent dyes in the knee joint. Fluorescent dyes were evenly distributed in the right knee joint of normal mice following intraarticular (i.a.) injection of 5.0 mM Rhodamine B (top panel) and 5.0 mM TRITC-Dextran (bottom panel) 30 min post-injection. Fluorescence was visualized using Texas Red emission filter channels, and bright-field images were captured using the EVOS imaging system as described in the Materials and Methods section. n = 3, and representative images were shown. Scale bar: 250 μm
Fig. 2
Fig. 2
High water-solubility of Rhodamine B and TRITC-Dextran. Both fluorescent dye Rhodamine B and TRITC-Dextran exhibit high water solubility, leading to dye washout when samples are fixed with aqueous solutions. To preserve the fluorescent dye, a hydrophobic “rehydration” method was employed on the tibial samples. A. Fluorescence of Rhodamine B was well-preserved and pronounced in samples processed with 100 % ethanol, but it showed substantial washout in samples rehydrated with 70 % ethanol and was nearly undetectable in those rehydrated with 4 % paraformaldehyde (PFA). B. Similarly, TRITC-Dextran fluorescence was retained and prominent in samples treated with 100 % ethanol but was almost completely lost in samples rehydrated with 70 % ethanol or 4 % PFA. Fluorescence visualization was performed using bright-field and Texas Red emission filter channels with the EVOS system, as detailed in the Materials and Methods section. Top panel: 4× merged images of bright-field and Texas Red channel; Middle panel: Magnified merged images from the boxed region in the top panel; Bottom panel: Fluorescent image of the Texas Red channel from the boxed region. n = 3, and representative images were shown. Scale bar: 250 μm
Fig. 3
Fig. 3
Dose–response study of fluorescent dye diffusion post intra-articular injection in normal mice. A. Mice received i.a. injections of Rhodamine B at concentrations of 5 mM, 10 mM, 20 mM, and 40 mM into the right knee joint. The mice were maintained under standard housing conditions post-injection, and the knee joints were collected 30 min after the injection for analysis. The summarization of schematic timelines for the injection of Rhodamine B before the mouse sacrifice in each group are shown (right top panel). The quantified relative fluorescence intensity from three independent experiments is shown for AC (right middle panel) and CC + SB (right bottom panel). B. Mice received i.a. injections of TRITC-Dextran at concentrations of 2.5 mM, 5 mM, 7.5 mM, and 10 mM into the right knee joint. The mice were maintained under standard housing conditions postinjection, and the knee joints were collected 1.0 h after the injection for analysis. The summarization of schematic timelines for the injection of TRITC-Dextran before the mouse sacrifice in each group are shown (right top panel). The quantified relative fluorescence intensity from three independent experiments is shown for AC (right middle panel) and CC + SB (right bottom panel). Statistical significance was defined as p < 0.05. Scale bar: 250 μm.
Fig. 4
Fig. 4
Time-course study of fluorescent dye diffusion post intra-articular injection in normal mice. A. Mice received i.a. injections of 40 mM Rhodamine B into the right knee joint and were kept alive post-injection. Euthanasia was performed at 7.5, 15, 30, and 60 min post-injection for fluorescence analysis. The summarization of schematic timelines for the injection of Rhodamine B before the mouse sacrifice in each group are shown (right top panel). The quantified relative fluorescence intensity from three independent experiments is shown for AC (right middle panel) and CC + SB (right bottom panel). B. Mice received i.a. injections of 10 mM TRITC-Dextran into the right knee joint and were kept alive post-injection. Euthanasia was performed at 0.5, 1, 2, and 4 h postinjection for fluorescence analysis. The summarization of schematic timelines for the injection of TRITC-Dextran before the mouse sacrifice in each group are shown (right top panel). The quantified relative fluorescence intensity from three independent experiments is shown for AC (right middle panel) and CC + SB (right bottom panel). Statistical significance was defined as p < 0.05. Scale bar: 250 μm.
Fig. 5
Fig. 5
Safranin-O/Fast Green staining of Sham and DMM mice. A. Two weeks post-surgery, no significant difference in OARSI grade was observed between the Sham and DMM groups. B. Eight weeks post-surgery, the OARSI grade was significantly higher in the DMM group compared to the Sham group. Images in the top panel represent 4× magnification, while the bottom panel shows a 20× magnified view of the boxed region from the top panel. n = 6/group, statistical significance was defined as p < 0.05. Scale bar: 125 μm.
Fig. 6
Fig. 6
Permeability of AC and CC + SB to Rhodamine B and TRITC-Dextran at two weeks postsurgery. A. Due to the high permeability of the AC to Rhodamine B, saturation was achieved within the AC in both the Sham and DMM groups. The permeability of the CC + SB to Rhodamine B was much lower than that of the AC, with no significant differences observed between the DMM and Sham groups two weeks postoperatively. B. The permeability of the AC to TRITC-Dextran increased as early as two weeks post-surgery, while the permeability of the CC + SB to TRITC-Dextran remained unchanged at this time point. n = 7–8/group, statistical significance was defined as p < 0.05. Scale bar: 250 μm.
Fig. 7
Fig. 7
Permeability of AC and CC + SB to Rhodamine B and TRITC-Dextran at eight weeks postsurgery. A. Saturation of Rhodamine B was observed within the AC in both the Sham and DMM groups. The permeability of the CC + SB to Rhodamine B was significantly higher in the DMM group compared to the Sham group eight weeks postoperatively. B. The increased permeability of the AC to TRITC-Dextran persisted eight weeks post-surgery, while the permeability of the CC + SB to TRITC-Dextran remained unchanged. n = 8/group, statistical significance was defined as p < 0.05. Scale bar: 250 μm.
Fig. 8
Fig. 8
Collagen II IHC staining of Sham and DMM mice. A. At two weeks post-surgery, a slight reduction in Collagen II staining intensity was observed in the AC and CC region of the DMM group, though these changes were not statistically significant. B. At eight weeks post-surgery, IHC staining intensity of Collagen II showed a significant reduction in both the AC and CC regions in the DMM group compared to the Sham group. Images in the top panel represent 4× magnification, while the bottom panel shows a 20× magnified view of the boxed region from the top panel. n = 6/group, statistical significance was defined as p < 0.05. Scale bar: 125 μm.

Similar articles

Cited by

References

    1. Loeser R.F., Goldring S.R., Scanzello C.R., Goldring M.B. Osteoarthritis: a disease of the joint as an organ. Arthritis Rheum. 2012;64(6):1697–1707. - PMC - PubMed
    1. Fazio A., Di Martino A., Brunello M., Traina F., Marvi M.V., Mazzotti A., et al. The involvement of signaling pathways in the pathogenesis of osteoarthritis: an update. J Orthop Translat. 2024;47:116–124. - PMC - PubMed
    1. Lories R.J., Luyten F.P. The bone-cartilage unit in osteoarthritis. Nat Rev Rheumatol. 2011;7(1):43–49. - PubMed
    1. Yao X., Sun K., Yu S., Luo J., Guo J., Lin J., et al. Chondrocyte ferroptosis contribute to the progression of osteoarthritis. J Orthop Translat. 2021;27:33–43. - PMC - PubMed
    1. DeMoya C.D., Joenathan A., Lawson T.B., Felson D.T., Schaer T.P., Bais M., et al. Advances in viscosupplementation and tribosupplementation for early-stage osteoarthritis therapy. Nat Rev Rheumatol. 2024;20(7):432–451. - PMC - PubMed

LinkOut - more resources