. 2025 Apr 22:36:73-81.
doi: 10.1016/j.jmsacl.2025.04.007. eCollection 2025 Apr.

Validation of an LC-MS/MS method for urinary homovanillic and vanillylmandelic ACIDS and application to the diagnosis of neuroblastoma

Affiliations

Validation of an LC-MS/MS method for urinary homovanillic and vanillylmandelic ACIDS and application to the diagnosis of neuroblastoma

Lucilla Rossi et al. J Mass Spectrom Adv Clin Lab. .

Abstract

Background: Urinary catecholamine metabolites are well-established biomarkers for neuroblastoma (NB). Homovanillic acid (HVA) and vanillylmandelic acid (VMA) are the most frequently measured metabolites within SIOPEN - Catecholamine Working Group laboratories. Here, we evaluated the performance of a new LC-MS/MS in vitro diagnostic (IVD) kit for HVA and VMA to facilitate inter-laboratory harmonization.

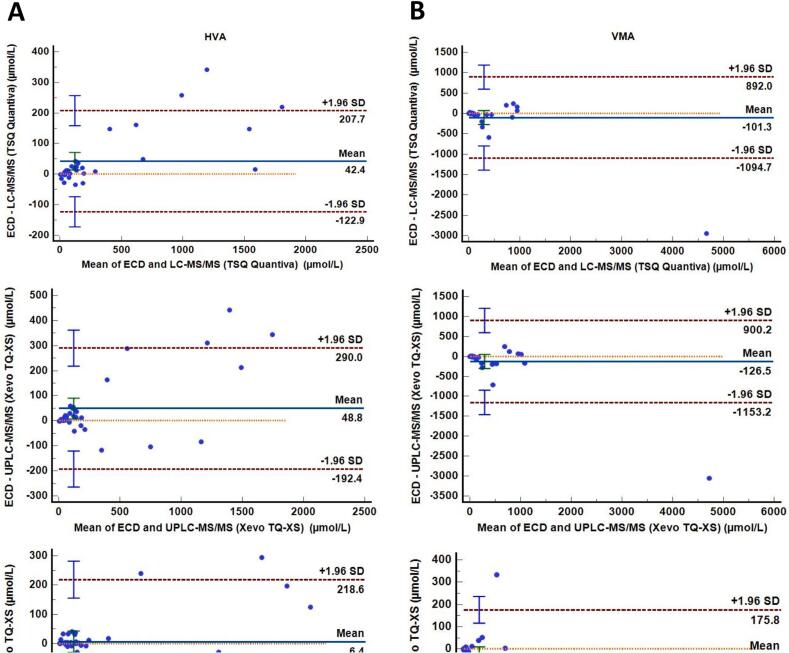
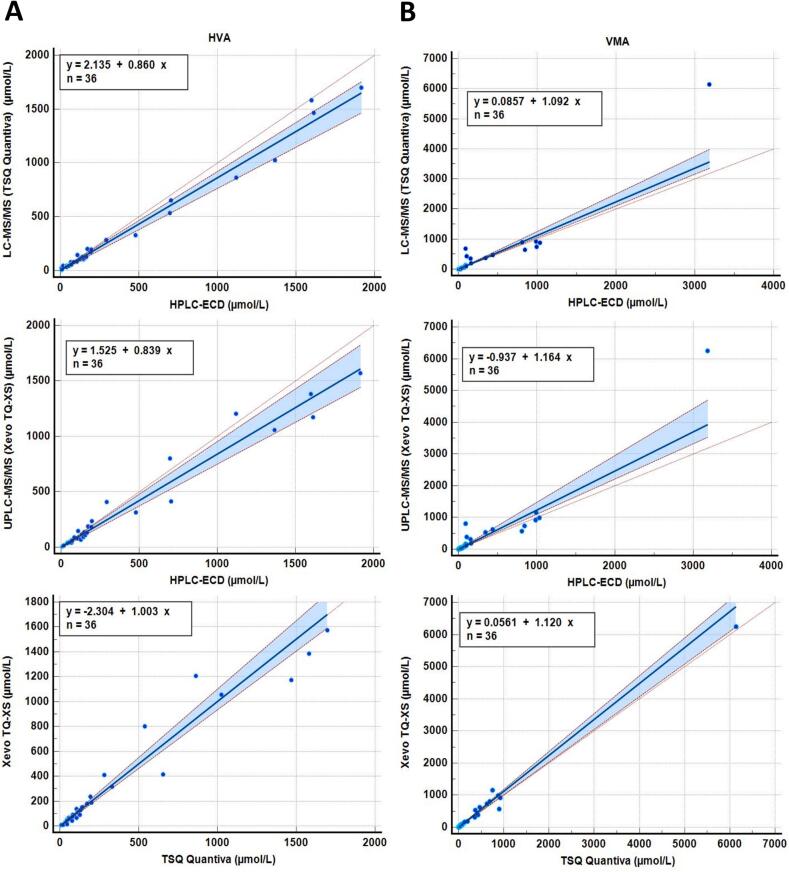
Methods: HVA and VMA and their deuterated internal standards were analyzed with a commercial method, on a ThermoFisher Quantiva LC-MS/MS. Validation was performed first using internal quality control and external quality assessment (IQC and EQA) samples. Next by clinical validation on 120 samples, previously tested by HPLC-ECD. Finally, 36 samples were exchanged between SIOPEN reference laboratories and analyzed by three methods.

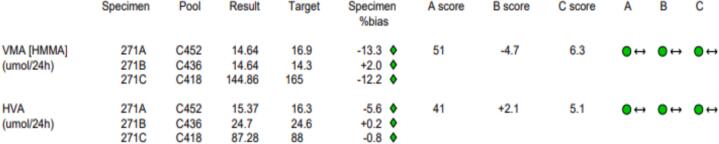
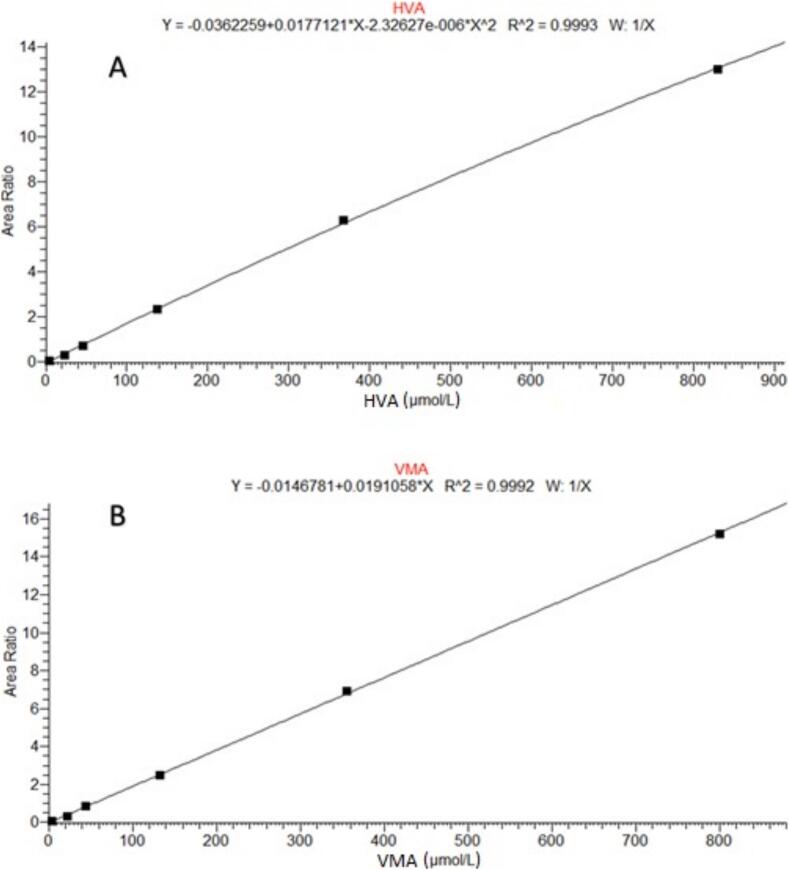
Results: Using QCs and EQA the method was validated in a wide calibration range (4.61-830 µmol/L for HVA and 4.44-800 µmol/L for VMA). Intra-day CVs (n = 5) were 7 and 8 % for HVA and 5 and 6 % for VMA for QC low and QC high, respectively; Inter-day CV% were 7 and 3 % for HVA and 2 and 7 % for VMA at QC low and QC high, respectively. Its application to 120 clinical samples confirmed a high diagnostic accuracy. The inter-laboratory quality control assessment showed interchangeable results (p = 0,73 and p = 0.15 for HVA and VMA, respectively).

Conclusion: The LC-MS/MS IVD method could be considered a useful tool for clinical laboratories involved in the measurement of catecholamines, contributing to harmonization efforts.

Keywords: Homovanillic acid; Inter-laboratory harmonization; Liquid Chromatography-tandem Mass Spectrometry; Neuroblastoma; Pediatrics; Urinary catecholamine; Vanillylmandelic acid.


Conflict of interest statement

The authors declare that they have no known competing financial interests or personal relationships that could have appeared to influence the work reported in this paper.

Figures

Fig. 1
Fig. 1
From UK NEQUAS report for Urinary Catecholamines & Metabolites. Analytical Performance for specimens from distribution 271(EQA). The green traffic light reflects that the laboratory is performing as well as the state-of-the-art allows. The urine volume has been assumed to be 1.0L, collected over a 24 h period, to avoid there being confusion between those laboratories that report in units/L and those that report in units/24 h. (For interpretation of the references to colour in this figure legend, the reader is referred to the web version of this article.)
Fig. 2
Fig. 2
Six-point mean calibration curve for HVA and VMA in urine. The r2, slope and y-intercept were measured on three independent calibration curves. (Area Ratio, peak area of analyte /peak area of IS).
Fig. 3
Fig. 3
A and B: Bland–Altman plot of inter-laboratory comparison between the reference method HPLC-ECD, the new LC-MS/MS method performed by TSQ Quantiva and Utrecht laboratory method UPLC-MS/MS performed by Xevo TQ-XS for HVA and VMA. The blue solid line indicates the mean difference (=bias) between the two methods. The brown dashed lines indicate the upper and lower 95 % LoA (= bias ± 1.96 × SD). The outlier in panel B, noticeable in the comparison between the ECD method and both LC-MS/MS methods, was a sample with a very high value for VMA. The large negative difference between the two methods is due to the fact that for this sample, with high analyte concentration, analysis by HPLC-ECD reveals a poor linear range of the detector in high concentrations. Results are expressed in µmol/L. (For interpretation of the references to colour in this figure legend, the reader is referred to the web version of this article.)
Fig. 4
Fig. 4
A and B: Inter-laboratory comparison between the reference method HPLC-ECD, the new LC-MS/MS method performed by TSQ Quantiva and Utrecht laboratory method UPLC-MS/MS performed by Xevo TQ-XS for HVA and VMA. In the Passing–Bablok regression, the red dotted line indicates the regression in case of perfect agreement. The blue solid line represents the actual regression obtained by the comparison of HPLC-ECD and LC-MS/MS methods. The brown dashed lines represent the 95% CI around the obtained regression. The outlier in panel B, noticeable in the comparison between the ECD method and both LC-MS/MS methods, was a sample with a very high value for VMA. The large negative difference between the two methods is due to the fact that for this sample, with high analyte concentration, analysis by HPLC-ECD reveals a poor linear range of the detector in high concentrations. Results are expressed in µmol/L. (For interpretation of the references to colour in this figure legend, the reader is referred to the web version of this article.)

Similar articles

References

    1. Ahmed A.A., Zhang L., Reddivalla N., Hetherington M. Neuroblastoma in children: Update on clinicopathologic and genetic prognostic factors. Solid Tumors Neurooncol. 2017;34:165–185. doi: 10.1080/08880018.2017.1330375. - DOI - PubMed
    1. Park J.R., Eggert A., Caron H. Neuroblastoma: biology, prognosis, and treatment. Hematol Oncol Clin North Am. 2010;24:65–86. doi: 10.1016/J.HOC.2009.11.011. - DOI - PubMed
    1. Barco S., Verly I., Corrias M.V., Sorrentino S., Conte M., Tripodi G., et al. Plasma free metanephrines for diagnosis of neuroblastoma patients. Clin Biochem. 2019;66:57–62. doi: 10.1016/J.CLINBIOCHEM.2019.02.012. - DOI - PubMed
    1. Matser Y.A.H., Verly I.R.N., van der Ham M., de Sain-van der Velden M.GM., Verhoeven-Duif N.M., Ash S., et al. Optimising urinary catecholamine metabolite diagnostics for neuroblastoma. Pediatr Blood Cancer. 2023;70 doi: 10.1002/PBC.30289. - DOI - PubMed
    1. Verly I.R.N., van Kuilenburg A.B.P., Abeling N.G.G.M., Goorden S.M.I., Fiocco M., Vaz F.M., et al. Catecholamines profiles at diagnosis: Increased diagnostic sensitivity and correlation with biological and clinical features in neuroblastoma patients. Eur. J. Cancer. 2017;72:235–243. doi: 10.1016/J.EJCA.2016.12.002. - DOI - PubMed

LinkOut - more resources