. 2025 Apr 29;11(1):veaf019.
doi: 10.1093/ve/veaf019. eCollection 2025.

Eco-evolutionary dynamics of temperate phages in periodic environments

Affiliations

Eco-evolutionary dynamics of temperate phages in periodic environments

Tapan Goel et al. Virus Evol. .

Abstract

Bacteriophages (viruses that exclusively infect bacteria) exhibit a continuum of infection mechanisms, including lysis and lysogeny in interactions with bacterial hosts. Recent work has demonstrated the short-term advantages of lysogeny over lysis in conditions of low host availability. Hence, temperate phage which can switch between lytic and lysogenic strategies-both stochastically and responsively-are hypothesized to have an evolutionary advantage in a broad range of conditions. However, the long-term advantages of lysogeny are not well understood, particularly when environmental conditions vary over time. To examine generalized drivers of viral strategies over the short- and long-term, we explore the eco-evolutionary dynamics of temperate viruses in periodic environments with varying levels of host availability and viral mortality. We use a nonlinear system of ordinary differential equations to simulate periodically-forced dynamics that separate a 'within-growth' phase and a 'between-growth' phase, in which a (potentially unequal) fraction of virus particles and lysogens survive. Using this ecological model and invasion analysis, we show and quantify how conflicts can arise between strategies in the short term that may favour lysis and strategies in the long term that may favour lysogeny. In doing so, we identify a wide range of conditions in which temperate strategies can outperform obligately lytic or lysogenic strategies. Finally, we demonstrate that temperate strategies can mitigate against the potential local extinction of viruses in stochastically fluctuating environments, providing further evidence of the eco-evolutionary benefits of being temperate.


Conflict of interest statement

None declared.

Figures
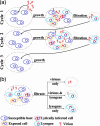
Figure 1.
Figure 1.
Schematic of the serial passage model: (a) In the first cycle, a fresh batch of nutrients and susceptible cells are inoculated with free virus particles. After a growth cycle, the system will have susceptible hosts, lysogens, lytically infected cells, and free virus particles. These cells (viruses) pass through a filter after which only a subset of susceptible cells, lysogens, and free viruses remain (in this case, lysogens and free viruses pass through the filter). This filtrate is now used to inoculate the new batch of host cells in cycle 2, and so on. The composition of the system at the end of each growth cycle changes, leading to changes in the composition of the filtrate, which in turn changes the initial conditions for the subsequent cycles. These cycles continue indefinitely or until the system reaches a steady state. (b) The filtration step can isolate virions alone (e.g. via size-dependent filtering), lysogens alone (e.g. via the use of phage-encoded antibiotic selection markers), or a mixture of the two.
Figure 2.
Figure 2.
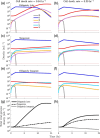
Short-term population dynamics: Population dynamics during a 24-hr growth cycle for (a, b) obligately lytic formula image, (c, d) temperate (formula image in (c); formula image in (d)) and (e, f) lysogenic formula image viruses. (g, h) Total viral genome density formula image for the obligately lytic (solid line), temperate (dashed line), and obligately lysogenic (dotted line) viruses. All other simulation parameters are given in Table S1 and Table S2. The cell death rates (formula image) are formula image in a, c, e, and g and, formula image in b, d, f, and h. Dotted horizontal red line in a-f represents the critical density threshold formula image mL−1.
Figure 3.
Figure 3.
Long-term population dynamics: Total viral genome densities over the first three 24-hr growth cycles for obligately lytic formula image (formula image), temperate formula image (formula image) and lysogenic formula image (formula image) viruses when (a) only virions (formula image), (c) lysogens and virions (formula image), and (e) only lysogens (formula image) pass through the filter. Total viral genome densities at the beginning of each growth cycle for obligately lytic formula image (formula image), temperate formula image (formula image) and lysogenic formula image (formula image) viruses when (b) only virions, (d) lysogens and virions, and (f) only lysogens pass through the filter. The dashed vertical lines at the 24, 48, and 72 hr marks in plots a, c, and e correspond to the dashed vertical lines at cycle numbers 1, 2, and 3 in plots b, d, and f, respectively. All other simulation parameters are given in Table S1 and Table S2. Dotted horizontal red line in a–f represents the critical density threshold formula image mL−1.
Figure 4.
Figure 4.
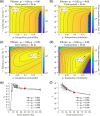
Steady states for different long-term selection pressures: Heatmaps of the density of viral genome copies at the beginning of a steady state growth cycle across different induction rates and integration probabilities when only virions (formula image) are passaged every (a) 24 hr and every (b) 48 hr, and when only lysogens (formula image) are passaged every (c) 24 hr and every (d) 48-hr. The set formula image denotes the strategies that maximize the steady-state viral genome density for the given filtration and cycle period conditions. (e) Integration probabilities and (f) induction rates of strategies that maximize the steady state total viral genome density as a function of cycle period. Induction rates are not plotted for strategies where formula image, since induction is not meaningful when no lysogens can be created. Line colours correspond to the fraction of lysogens that pass from one cycle to the next. Fraction of virions in the filtrate (qV) is set to zero. The red squares in c, e, and f correspond to the same strategy for the same filtration and cycle period conditions. Similarly, the red circles in d, e, and f correspond to the same strategy. All other simulation parameters can be found in Table S1 and Table S2.
Figure 5.
Figure 5.
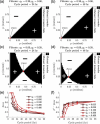
Invasion analysis: PIP when only virions (formula image) are passaged every (a) 24 hr and every (b) 48 hr, and when only lysogens (formula image) are passaged every (c) 24 hr and every (d) 48 hr. Red markers indicate the evolutionarily stable integration probability (pESS) for fixed induction rates corresponding to those that maximize viral genome density at steady state (formula image) for each condition. Dark grey regions correspond to integration probabilities at which the resident virus does not persist in the one host-one virus system (see section 2.3 for details). Light grey marks regions where the resident and mutant have identical life history strategies. (e) Evolutionarily stable integration probability as a function of cycle period. Colours correspond to the fraction of lysogens that pass from one cycle to the next. The ESS for each condition is calculated by setting the induction rate to be the viral genome density maximizing the induction rate for that condition. (f) Difference between the steady-state viral genome maximizing integration probability and the evolutionarily stable integration probability for different cycle periods and filtration conditions. The red squares in c, e, and f correspond to the same strategy for the same filtration and cycle period conditions. Similarly, the red circles in d, e, and f correspond to the same strategy. All other simulation parameters can be found in Table S1 and Table S2.
Figure 6.
Figure 6.
Population dynamics with stochastic filtration: (a) qV values for 100 growth cycles, chosen from a log uniform distribution over the span formula image. Population densities at the end of each growth cycle for (b) obligately lytic (formula image), (c) temperate (formula image) and (d) obligately lysogenic (formula image) viruses across hundred 24-hr growth cycles. In total, 10 per cent lysogens (formula image) are passaged from one cycle to the next in every case, but the virion fraction passaged from cycle to cycle is set by qV shown in (a). Markers at every 5th cycle denote that the lines represent discrete cycle-to-cycle dynamics and not continuous-time dynamics. Heatmaps showing the probability that temperate viruses with strategies (e) formula image and (f) formula image survive 100 growth cycles where the filtration parameters qL and qV are drawn independently from log-uniform distributions with spans formula image and formula image, respectively. The cell death rates formula image are set to formula image in e and formula image in f. The x and y axis mark formula image and formula image, respectively. The dotted and dashed lines represent the lower thresholds for an obligate lytic virus (formula image) to survive 100 growth cycles with probabilities of 0.05 and 0.95, respectively. All other simulation parameters can be found in Table S1 and Table S2.

References

    1. Abedon ST. Bacteriophages as Drivers of Evolution: An Evolutionary Ecological Perspective. Springer International Publishing, 2022. 10.1007/978-3-030-94309-7 - DOI
    1. Abedon ST, Herschler TD, Stopar D Bacteriophage latent-period evolution as a response to resource availability. Applied and Environmental Microbiology 2001;67:4233–4241. 10.1128/AEM.67.9.4233-4241.2001 - DOI - PMC - PubMed
    1. Aframian N, Omer Bendori S, Kabel S et al. Dormant phages communicate via arbitrium to control exit from lysogeny. Nature Microbiology 2021;7:145–153. 10.1038/s41564-021-01008-5 - DOI - PubMed
    1. Alrasheed H, Jin R, Weitz JS Caution in inferring viral strategies from abundance correlations in marine metagenomes. Nature Communications 2019;10:501. 10.1038/s41467-018-07950-z - DOI - PMC - PubMed
    1. Basso JTR, Ankrah NYD, Tuttle MJ et al. Genetically similar temperate phages form coalitions with their shared host that lead to niche-specific fitness effects. The ISME Journal 2020;14:1688–1700. 10.1038/s41396-020-0637-z - DOI - PMC - PubMed

LinkOut - more resources