. 2025 Aug 12;66(7):1044-1060.
doi: 10.1093/pcp/pcaf055.

Oxygen supply is a prerequisite for response to aluminum in cultured cells of tobacco (Nicotiana tabacum)

Affiliations

Oxygen supply is a prerequisite for response to aluminum in cultured cells of tobacco (Nicotiana tabacum)

Yoshiyuki Tsuchiya et al. Plant Cell Physiol. .

Abstract

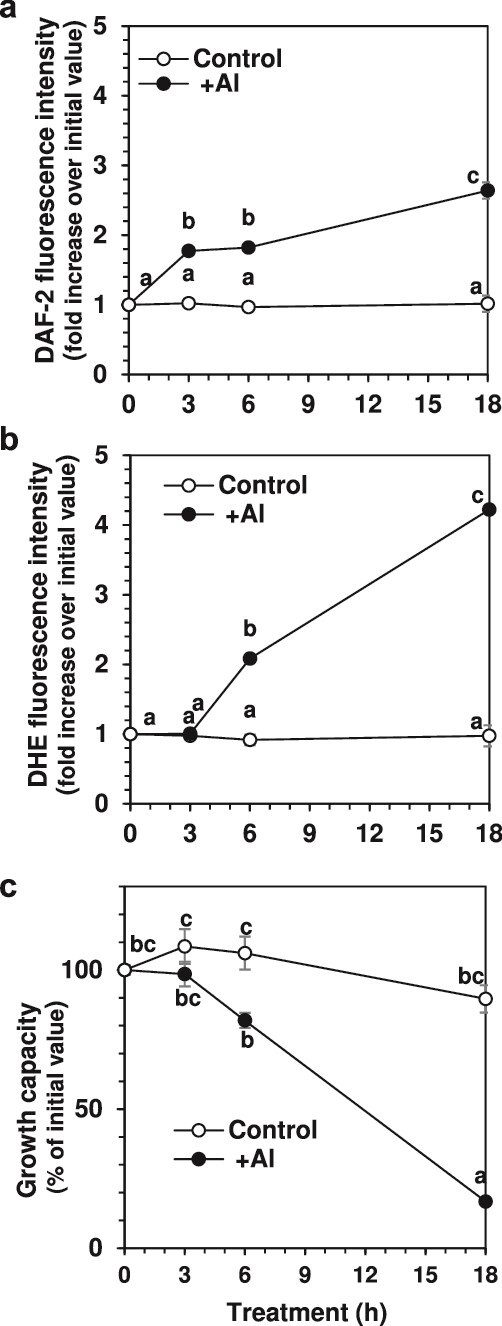
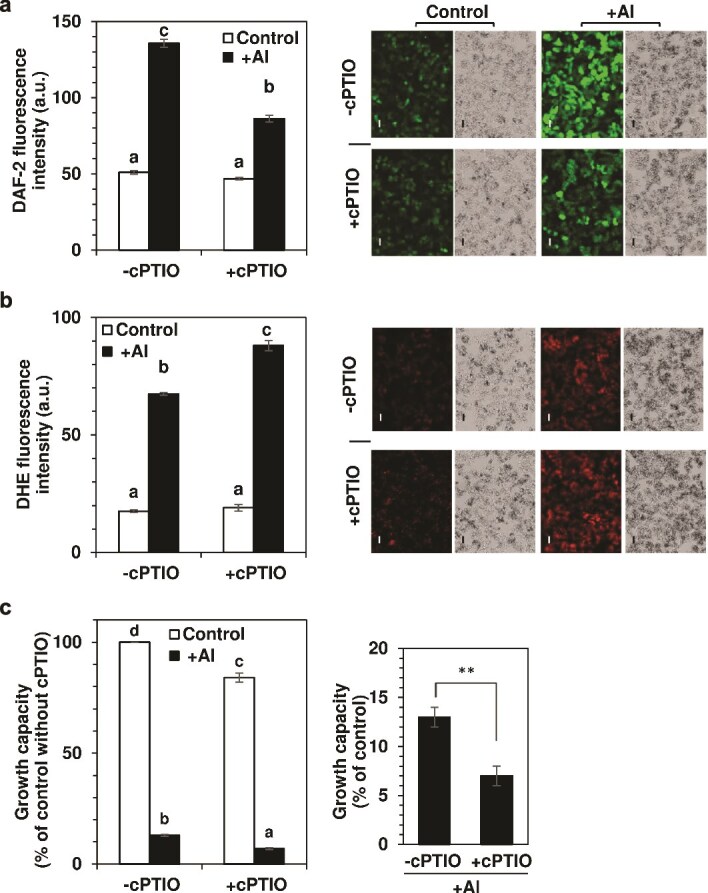
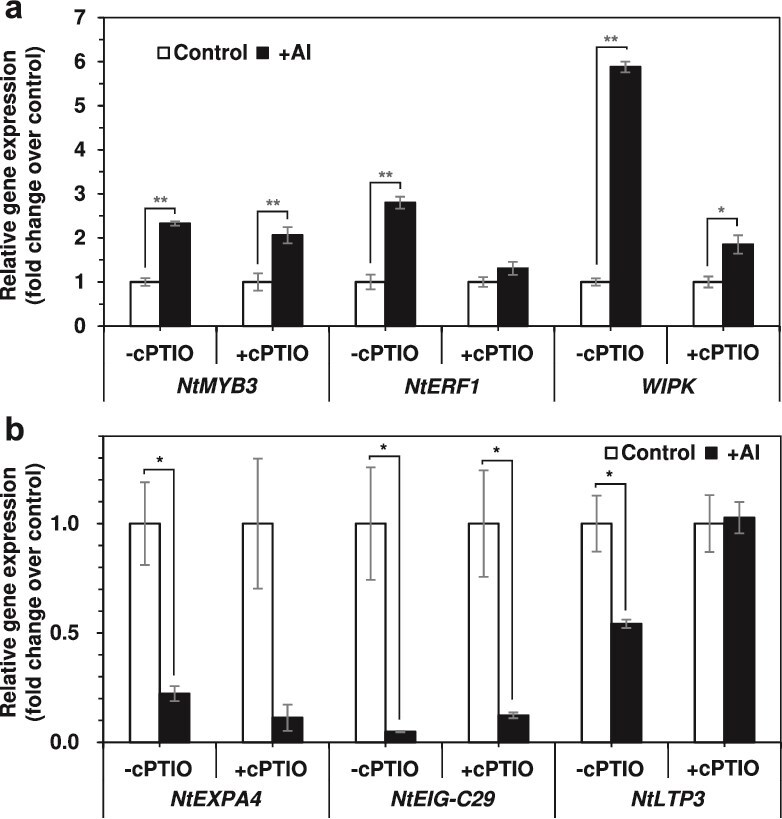
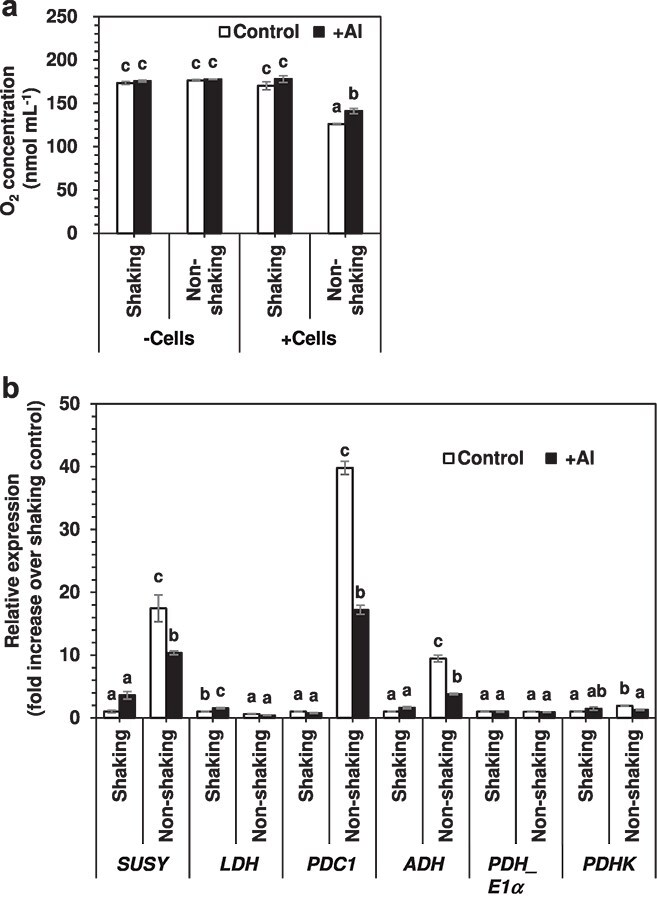
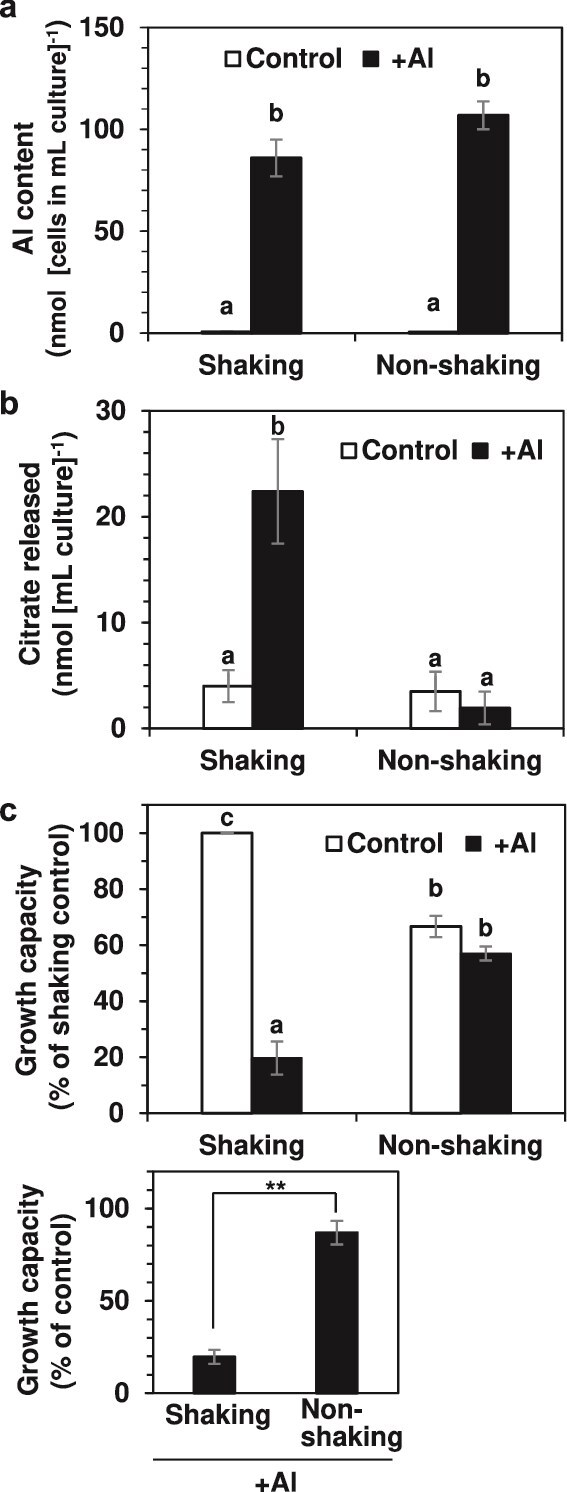
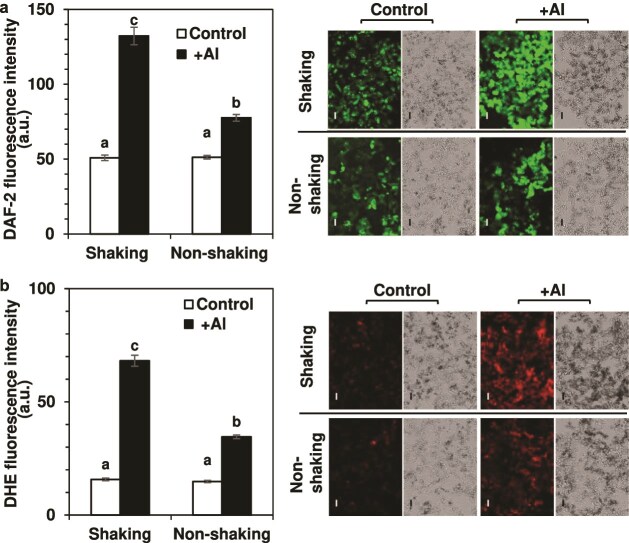
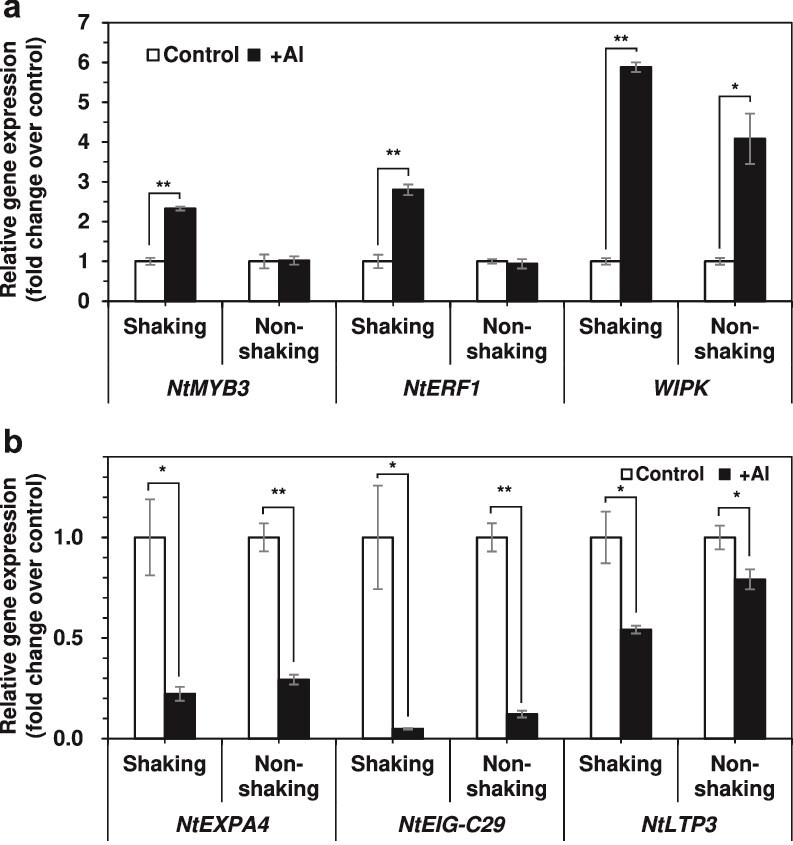
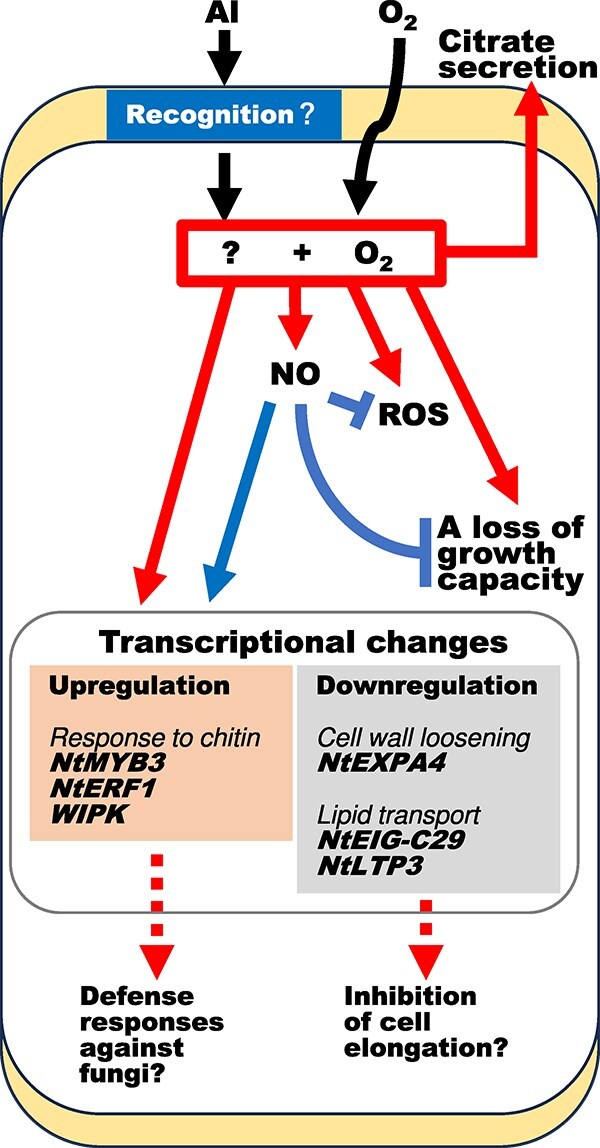
Responses to aluminum (Al) were investigated in tobacco cells (cell line SL) in a calcium-sucrose solution for up to 24 h under shaking (aerobic) condition. Microarray analysis of upregulated and downregulated genes under Al exposure and following Gene Ontology (GO) enrichment analysis of biological process category revealed only one GO term to be enriched for the upregulated genes, "response to chitin," annotated with genes encoding transcription factors (NtERF1 and NtMYB3) and MAP kinase (WIPK), and nine GO terms for the downregulated genes, including "cell wall loosening" and "lipid transport," annotated with genes encoding expansin (NtEXPA4) and lipid transfer protein (LTP)/LTP-like (NtLTP3 and NtEIG-C29), respectively. Al triggered the production of nitric oxide (NO) then reactive oxygen species (ROS). Addition of NO scavenger 2-(4-carboxyphenyl)-4,4,5,5-tetramethylimidazoline-1-oxyl-3-oxide decreased the levels of NO and a part of the transcriptional changes described above, but increased the levels of ROS and a loss of growth capacity, suggesting a role of the NO to induce the transcriptional changes partly and to repress these toxic responses under Al exposure. Under non-shaking (anaerobic) condition, the cells exhibited upregulation of several hypoxia-responsive genes. The cells exposed to Al exhibited the same level of Al accumulation but much lower levels of the Al responses including NO production, ROS production, a loss of growth capacity, citrate secretion, and a part of the transcriptional changes described above, compared with the cells under shaking condition. These results suggest that coexistence of oxygen with Al is necessary to trigger the Al responses related to toxicity and tolerance.

Keywords: aluminum toxicity; aluminum-responsive genes; cell wall loosening; chitin-responsive genes; dioxygen; hypoxia.


Conflict of interest statement

The authors have no conflicts of interest to declare.

Figures

Figure 1
Figure 1
Time course of the effects of Al on NO production, ROS production, and growth capacity in SL cells under shaking condition. Cells were treated without (control) or with 100 μM AlCl3 (+Al) for up to 18 h under shaking condition. At times indicated, cells were withdrawn for determinations of the levels of NO (a), ROS (b), and growth capacity (c) as described in Materials and Methods. In (a) and (b), fluorescence images of NO and ROS in cells obtained by staining with DAF-2 DA and DHE, respectively, were quantitatively determined as described in Materials and Methods. Different letters in each figure indicate statistically significant differences among all the samples (P < .05, Tukey–Kramer test). Values in (a, b) are the mean ± SE (n = 45 cell areas from three independent experiments). Values in (c) are the mean ± SE (n = 4 from independent experiments).
Figure 2
Figure 2
Effects of cPTIO on Al responses (NO production, ROS production, a loss of growth capacity) in SL cells under shaking condition. Cells were treated without (control) or with 100 μM AlCl3 (+Al) in the presence or absence of 100 μM cPTIO for 18 h under shaking condition. Then, the levels of NO (a), ROS (b), and growth capacity (c) were determined. In (a) and (b), fluorescence images of NO and ROS in cells (right) obtained by staining with DAF-2 DA and DHE, respectively, are indicated with bright images of cells. The experiments were repeated three times independently, giving reproducible results. Here shows representative images. Bar indicates 100 μM. Then, the levels of NO and ROS were quantitatively determined as fluorescence intensity of DAF-2 and DHE images, respectively (left), as described in Materials and Methods. In (c), growth capacity of the cells treated under different conditions [without (control) or with Al in the absence or presence of cPTIO] is indicated as the extent of growth relative to that of the control cells treated in the absence of cPTIO (left). Growth capacity of Al-treated cells relative to control cells is also indicated under the treatment without and with cPTIO, respectively (right). Significant difference between them is indicated with asterisk (**P < .01, Welch’s t-test). In (a, b, c), different letters in each figure indicate statistically significant differences among four samples (P < .05, Tukey–Kramer test). Values in (a, b) are the mean ± SE (n = 45 cell areas from three independent experiments). Values in (c) are the mean ± SE (n = 4 from independent experiments).
Figure 3
Figure 3
Effect of cPTIO on responsiveness to Al of the Al-responsive genes (NtMYB3, NtERF1, WIPK, NtEXPA4, NtEIG-C29, and NtLTP3) in SL cells under shaking condition. Cells were treated without (control) or with 100 μM AlCl3 (+Al) in the absence or presence of 100 μM cPTIO for 18 h under shaking condition. Then, cells were harvested for expression analyses of the genes responsive to Al under shaking condition positively, NtMYB3, NtERF1, and WIPK (a), and negatively, NtEXPA4, NtEIG-C29, and NtLTP3 (b), by real-time RT-PCR as described in Materials and Methods. In each gene analysis, significant difference between two treatments (control, +Al) is indicated with asterisk (*P < .05, **P < .01, Welch’s t-test). Values are the ratio relative to control (the mean ± SE, n = 4 from independent experiments).
Figure 4
Figure 4
Effects of non-shaking condition on the oxygen concentration in medium and the expression of hypoxia-responsive genes in SL cells. In (a), the medium in the absence of cells (−cells) or presence of cells (+cells) were treated without (control) or with 100 μM AlCl3 (+Al) for 24 h under shaking or non-shaking conditions. Then, oxygen concentration in the medium was determined as described in Materials and Methods. Different letters indicate significant differences among the eight samples (P < .05, Tukey–Kramer test). Values are the mean ± SE (n = 3 from independent experiments). In (b), cells were treated without (control) or with 100 μM Al (+Al) for 18 h under shaking or non-shaking conditions. Then, cells were harvested for expression analyses of hypoxia-responsive genes (SUSY, LDH, PDC1, ADH, PDH_E1α, and PDHK) by real-time RT-PCR as described in Materials and Methods. Different letters in each gene analysis indicate statistically significant differences among four samples (P < .05, Tukey–Kramer test). Values are the mean ± SE (n = 4 from independent experiments).
Figure 5
Figure 5
Effects of non-shaking condition on Al responses (Al accumulation, citrate secretion, a loss of growth capacity) in SL cells. Cells were treated without (control) or with 100 μM AlCl3 (+Al) for 24 h under shaking or non-shaking conditions. Then, cells were withdrawn for determinations of Al accumulation (a) and growth capacity (c). On the other hand, cell suspension was withdrawn for determination of the concentration of citrate released into medium (b) as described in Materials and Methods. In (c), growth capacity of the cells treated under different conditions [without (control) or with Al under shaking or non-shaking] is indicated as the extent of growth relative to that of the control cells under shaking condition (top). Growth capacity of Al-treated cells relative to control cells is also indicated under shaking and non-shaking condition, respectively (bottom). Significant difference between them is indicated with asterisk (**P < .01, Welch’s t-test). In (a, b, c), different letters in each figure indicate statistically significant differences among four samples (P < .05, Tukey–Kramer test). Values are the mean ± SE [n = 4 in (a) and n = 3 in (b, c), from independent experiments, respectively].
Figure 6
Figure 6
Effects of non-shaking condition on Al responses (NO production, ROS production) in SL cells. Cells were treated without (control) or with 100 μM AlCl3 (+Al) for 18 h under shaking or non-shaking conditions. Then, the levels of NO (a) and ROS (b) were determined. Fluorescence images of NO and ROS in cells (right) obtained by staining with DAF-2 DA and DHE, respectively, are indicated with bright images of cells. The experiments were repeated three times independently, giving reproducible results. Here shows representative images. Bar indicates 100 μM. Then, the levels of NO and ROS were quantitatively determined as fluorescence intensity of DAF-2 and DHE images, respectively (left), as described in Materials and Methods. Different letters in each figure indicate statistically significant differences among four samples (P < .05, Tukey–Kramer test). Values are the mean ± SE (n = 45 cell areas from three independent experiments).
Figure 7
Figure 7
Effect of non-shaking condition on responsiveness to Al of the Al-responsive genes (NtMYB3, NtERF1, WIPK, NtEXPA4, NtEIG-C29, and NtLTP3) in SL cells. Cells were treated without (control) or with 100 μM AlCl3 (+Al) under shaking or non-shaking condition for 18 h. Then, cells were harvested for expression analyses of the genes responsive to Al under shaking condition positively, NtMYB3, NtERF1, and WIPK (a), and negatively, NtEXPA4, NtEIG-C29, and NtLTP3 (b), by real-time RT-PCR as described in Materials and Methods. In each gene analysis, significant difference between two treatments (control, +Al) is indicated with asterisk (*P < .05, **P < .01, Welch’s t-test). Values are the ratio relative to control (the mean ± SE, n = 4 from independent experiments). Note that the values (control, +Al) under shaking condition of each gene are the same as those values (control, +Al) without cPTIO shown in Fig. 3.
Figure 8
Figure 8
Mechanisms of responses to Al in tobacco cell line SL. This study reveals that oxygen supply during Al treatment is necessary for triggering five responses (NO production, ROS production, transcriptional changes, a loss of growth capacity, citrate secretion). In this model, several issues remain to be clarified, including the recognition site of Al on cell surface, the components of Al signaling pathway, the interruption mechanisms between oxygen molecule and the Al signaling pathway, a possibility of Al exposure to enhance fungus tolerance, and a possible involvement of the Al-induced transcriptional downregulation in the inhibition of cell elongation. For more details, see text. The processes of activation and inhibition are indicated with an arrow (↓) and a line with a bar (⊥), respectively. The processes to be clarified in the future are indicated either with a question mark or a broken line.

Similar articles

References

    1. Abdel-Basset, R., Ozuka, S., Demiral, T., Furuichi, T., Sawatani, I., Baskin, T.I., et al. (2010) Aluminium reduces sugar uptake in tobacco cell cultures: a potential cause of inhibited elongation but not of toxicity. J. Exp. Bot. 61:1597–1610. - PMC - PubMed
    1. Akaike, T., Yoshida, M., Miyamoto, Y., Sato, K., Kohno, M., Sasamoto, K., et al. (1993) Antagonistic action of imidazolineoxyl N-oxides against endothelium-derived relaxing factor/.NO through a radical reaction. Biochemistry 32:827–832. - PubMed
    1. Baier, R., Schiene, K., Kohring, B., Flaschel, E., Niehaus, K. (1999) Alfalfa and tobacco cells react differently to chitin oligosaccharides and Sinorhizobium meliloti nodulation factors. Planta. 210:157–164. - PubMed
    1. Chen, L.J., Zou, W.S., Fei, C.Y., Wu, G., Li, X.Y., Lin, H.H., et al. (2018) α-Expansin EXPA4 positively regulates abiotic stress tolerance but negatively regulates pathogen resistance in Nicotiana tabacum. Plant Cell Physiol. 59:2317–2330. - PubMed
    1. Cosgrove, D.J. (2015) Plant expansins: diversity and interactions with plant cell walls. Curr. Opin. Plant Biol. 25:162–172. - PMC - PubMed

LinkOut - more resources