. 2025 May 22;53(10):gkaf443.
doi: 10.1093/nar/gkaf443.

A conserved nuclease facilitates environmental DNA uptake

Affiliations

A conserved nuclease facilitates environmental DNA uptake

Juri Hanßmann et al. Nucleic Acids Res. .

Abstract

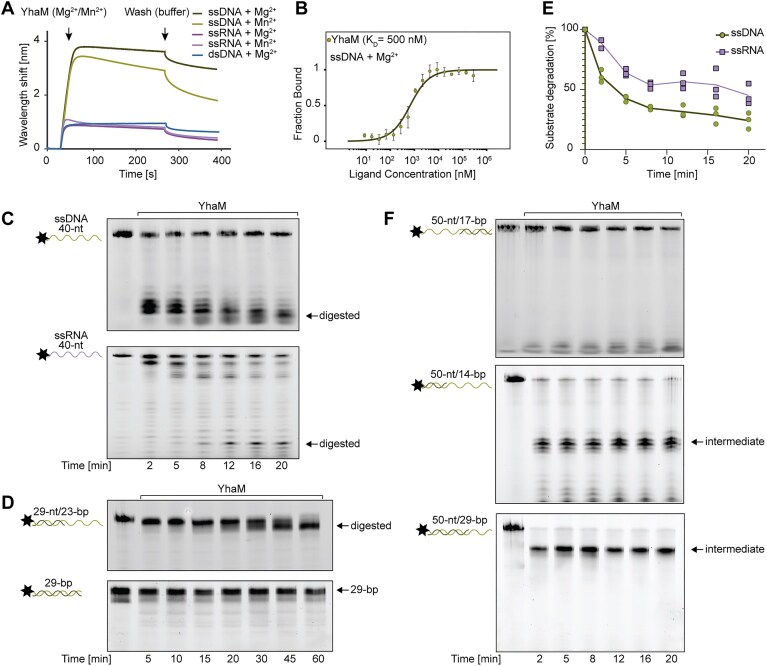
Bacteria acquire new traits through the uptake of genetic material from the environment, a process requiring DNA processing. However, the molecular inventory mediating this process is far from being completely understood. Here, we identify YhaM in Bacillus subtilis as a conserved 3'-deoxyribonuclease essential for the uptake and processing of genetic information in the form of single-stranded DNA. Our results show that YhaM assembles into hexamers in the presence of divalent cations, enhancing substrate binding, which is achieved through its conserved oligonucleotide-binding domain. Cells lacking YhaM show a severe defect in the uptake of plasmids and genomic DNA, but the transduction of double-stranded DNA by the phage SPP1 remains unaffected. These findings highlight a critical role of YhaM in single-stranded DNA maturation during natural transformation. Importantly, this function is conserved in various Gram-positive human pathogens such as Staphylococcus aureus, suggesting that it could contribute to the spread of antibiotic resistance.


Conflict of interest statement

None declared.

Figures

Graphical Abstract
Graphical Abstract
Figure 1.
Figure 1.
YhaM is required for full competence development. Analysis of the transformation efficiency of B. subtilis PY79 and an isogenic yhaM mutant (ΔyhaM) comparing (A) the chromosomal integration of extracellular DNA, (B) the uptake of a self-replicative plasmid, and (C) phage transduction using the dsDNA phage SPP1. To confirm the strict dependency of chromosomal DNA integration on RecA, a strain lacking RecA (ΔrecA) was included in the analyses. The dependency of DNA uptake from the environment on type IV-like pili was confirmed using ΔcomGC cells. To complement the ΔyhaM strain, a wild-type copy of yhaM was expressed ectopically from the amyE site under the control of the hyper-spank promoter. Leaky expression of yhaM from the hyper-spank promoter in the absence of the inducer IPTG was sufficient to complement the yhaM mutant. The bar charts show the mean values from four independent replicates (dots). Error bars indicate the standard deviation. The transformation efficiency plotted on the y-axis was calculated as the ratio of erythromycin-resistant transformants to total colony-forming units. The significance level was calculated using the Holm–Šídák method, using α = 0.05 and a t-test. p-values are indicated. (D) Localization of YhaM-mNG in wild-type (n = 1701) B. subtilis cells grown in competence-inducing conditions 30 min after addition of 0.1 μg/ml gDNA. Shown are representative phase contrast (Ph3) and fluorescence (mNG) images from three independent experiments. Bar: 2 μm. (E) Demographic analysis of YhaM-mNG localization in wild-type cells showing YhaM-mNG foci. (FG) As described for panels (D) and (E), but for ΔcomK (n = 1333). The relative fluorescence intensity is shown as a heat map with red dots indicating the area of highest intensity in each cell. The color code is given on the right. Cells are aligned at the cell center and sorted by cell length. The total number of cells analyzed for each strain and the percentage of cells showing foci are given for each strain. (H) Quantification of number and fluorescence intensity of YhaM-mNG foci per cell for wild-type (green) and ΔcomK (purple) cells. Each focus is represented by a dot, and the n indicates the number of cells analyzed. The fluorescence intensity of foci plotted on the y-axis was calculated as the difference between the focus fluorescence and the mean fluorescence of the cell body. The significance levels for the differences in fluorescence intensity were calculated with the Welch’s t-test, and the corresponding p-values are indicated.
Figure 2.
Figure 2.
YhaM shows a strong preference for ssDNA over dsDNA and ssRNA. (A) BLI analysis investigating the interaction of YhaM with ssDNA, dsDNA, and ssRNA in the presence of the indicated divalent cations. Depicted is a representative measurement from three independent experiments. (B) MST analysis of the affinity of YhaM for ssDNA. The equilibrium dissociation constant (KD = 500 nM) was calculated from three independent experiments. Error bars indicate the standard deviation. (CD, F) 20% of urea PAGE gels showing the digestion kinetics of (C) ssDNA and ssRNA and (DF) ssDNA/dsDNA hybrids with varying accessibility of single-stranded 3′-end DNA. For the ssDNA/dsDNA hybrids, the total length of the hybrids in nucleotides (nt) and the lengths of their dsDNA region (bp) are indicated. The star indicates the 5′ attachment site of the 6-carboxyfluorescein label. Nucleic acids were always digested in the presence of Mn2+ (10 mM). (E) YhaM-dependent ssRNA (violet) and ssDNA (green) degradation as quantified from gels shown in panel (A). Shown are the values obtained in three independent experiments.
Figure 3.
Figure 3.
Structural characterization of YhaM by cryo-EM. (A) Model of the process of YhaM assembly. (B) MP analysis of the oligomerization state of YhaM. The estimated molecular weights of the different YhaM species observed are 35 kDa (monomer), 70 kDa (dimer), 140 kDa (tetramer), and 210 kDa (hexamer). (C) Schematic showing the domain organization of YhaM, with the HD domain resolved by cryo-EM highlighted in gray. The amino acid sequence of the YhaM HD domain is shown, with secondary structural elements depicted schematically above the sequence, colored in a rainbow gradient from N- to C-terminus. The active site residues are underlined and highlighted in bold, while the residues involved in salt bridge formation during YhaM oligomerization are also shown in bold only. (D) Cartoon representation of a YhaM monomer, colored in a rainbow gradient from N- to C-terminus (denoted by “N” and “C,” respectively; PDB ID: 9H3F). Active site residues are depicted as sticks, while coordinated magnesium ions are shown as spheres. A magnified view of the active site highlights amino acids of the extended H…HD…HH…D motif, along with the two coordinated magnesium ions. Cryo-EM map densities (EMD-51819) at a 3σ contour level are displayed in transparent gray for the active site region. (E) Top-down and side views of the YhaM hexamer, illustrating its D3 symmetry. Individual monomers are color-coded. N-termini (denoted by “N”) oriented outward from the image plane are indicated. In the top-down view, one example of each of the two distinct interaction surfaces formed by D3 symmetry is shaded in gray. (F) Magnified views of the contact interfaces between two YhaM subunits, with residues contributing to salt bridge formation being indicated. Further details are provided in the main text.
Figure 4.
Figure 4.
Histidine/aspartic acid coordination of divalent cation enables YhaM oligomerization. (A) Reconstructed volume of YhaM, rendered at a low contour level, with fitted AlphaFold3 model (cartoon). The N-terminal OB-fold domain is shown in blue, and the hydrolase domain (HD) is shown in red. The AlphaFold3 model of a YhaM monomer at the right side shows the positions and names of the amino acid residues exchanged in the mutant proteins. (B) Analysis of the oligomeric state of mutant YhaM proteins by MP. MP shows that hexamer formation for YhaMY76A is facilitated by divalent cations and illustrates directed assembly of YhaM using oligonucleotides. The YhaMH193A/D194A almost completely lost its ability to form a hexameric assembly. (C) BLI analysis of the binding of YhaMY76A and YhaMH193A/D194A to ssDNA or ssRNA in the presence of Mg2+. Different oligonucleotides were immobilized on biosensors prior to the loading of YhaM. Three independent experiments were performed, and representative measurements are shown. (D) Representative 20% urea PAGE gel showing the digestion kinetics of 5′-FAM-labeled ssDNA and ssRNA.
Figure 5.
Figure 5.
Overproduction of YhaM results in reduced fitness and abnormal cell morphology. (A) Growth curves of the strains overproducing YhaM and variants thereof after induction with 1 mM IPTG. A strain producing RNase PH was used as a control. (B) Distribution of cell lengths in populations of the B. subtilis strains analyzed after 5 h of induction with 1 mM IPTG. Large dots represent the median values of each independent replicate (blue, green, red). Small dots represent the individual data points. p-values for significant comparisons (t-test) are indicated. (C) Localization of DNA by DAPI staining in strains producing YhaM or the indicated YhaM variants after 5 h of induction with 1 mM IPTG. White arrows indicate regions of DNA accumulation. Scale bar: 5 μm. (D) Colocalization of DAPI-stained chromosomal DNA and YhaM-mNG in the YhaM overproduction background. Arrowheads indicate the localization of the chromosome visualized by DAPI signal. To generate the demograph on the left, the DAPI fluorescence profiles were stacked vertically according to cell length. The color code is given on the right. Red dots represent the maximum fluorescence intensity of the YhaM-mNG fluorescence channel, indicating the subcellular positions of YhaM-mNG foci. The red line indicates the positions of the cell centers.
Figure 6.
Figure 6.
SaYhaM prefers ssDNA and enables ssDNA processing in B. subtilis. (A) Representative BLI measurement showing the interaction of different YhaM homologs with ssRNA or ssDNA. Oligonucleotides were first immobilized on BLI sensors and then incubated with either SaYhaM or BsYhaM. Experiments were performed three times. (B) Transformation efficiency of B. subtilis (PY79) during natural competence. The assays were performed with an erythromycin-resistant cassette flanked by homologous regions for recombination into the B. subtilis chromosome and a self-replicating plasmid that does not require recombination for its establishment in the cell. Wild-type and ΔyhaM cells as well as a strain complemented with the gene encoding SaYhaM were analyzed. Bars represent the mean values of four independent replicates. Error bars indicate the population standard deviation, and dots represent the data of individual measurements. Statistical significance was determined using a t-test. p-values for significant differences are shown. (C) Structural alignment of AlphaFold3 models of BsYhaM, SaYhaM, BaYhaM, and SpYhaM. For BsYhaM, the domain structure is indicated by colors (blue: OD domain; red: HD domain). The green sphere indicates a divalent cation (Mn2+).
Figure 7.
Figure 7.
YhaM processes ssDNA after uptake during natural competence in Gram-positive organisms. YhaM plays a crucial role in the competence of bacteria and acts as a gatekeeper for DNA uptake. During natural competence, environmental DNA is taken up by the retraction of a pilus structure into the periplasm. The non-transforming strand will be transferred through a channel protein into the periplasm, while the transforming strand is taken up. After its uptake, ssDNA will be directly bound by single-stranded binding proteins and RecA. RecA is involved in homologous recombination together with an endonuclease. YhaM processes the ssDNA that has entered the cytosol immediately after its uptake, enhancing its 3′ maturation for further integration (1). The maturation process must be regulated by a release factor (2) that controls ssDNA turnover and prevents the complete degradation of the imported ssDNA fragment. The utilization of DNA from the environment is strictly dependent on YhaM (3).

References

    1. Lerminiaux NA, Cameron ADS Horizontal transfer of antibiotic resistance genes in clinical environments. Can J Microbiol. 2019; 65:34–44. 10.1139/cjm-2018-0275. - DOI - PubMed
    1. Soucy SM, Huang J, Gogarten JP Horizontal gene transfer: building the web of life. Nat Rev Genet. 2015; 16:472–82. 10.1038/nrg3962. - DOI - PubMed
    1. Dubnau D, Blokesch M Mechanisms of DNA uptake by naturally competent bacteria. Annu Rev Genet. 2019; 53:217–37. 10.1146/annurev-genet-112618-043641. - DOI - PubMed
    1. Chung YS, Dubnau D ComC is required for the processing and translocation of comGC, a pilin-like competence protein of Bacillus subtilis. Mol Microbiol. 1995; 15:543–51. 10.1111/j.1365-2958.1995.tb02267.x. - DOI - PubMed
    1. Kilb A, Burghard-Schrod M, Holtrup S et al. Uptake of environmental DNA in Bacillus subtilis occurs all over the cell surface through a dynamic pilus structure. PLoS Genet. 2023; 19:e1010696. 10.1371/journal.pgen.1010696. - DOI - PMC - PubMed

MeSH terms