. 2025 May 22;53(10):gkaf439.
doi: 10.1093/nar/gkaf439.

The role of multivalency in the association of the eight twenty-one protein 2 (ETO2) with the nucleosome remodeling and deacetylase (NuRD) complex

Affiliations

The role of multivalency in the association of the eight twenty-one protein 2 (ETO2) with the nucleosome remodeling and deacetylase (NuRD) complex

Glory Dan-Dukor et al. Nucleic Acids Res. .

Abstract

Over the past 50 years, research has uncovered the co-regulatory proteins and complexes that silence the expression of the γ-globin gene in a developmental stage-specific manner. Recent research expanded the list of these regulatory factors by showing that the eight twenty-one protein 2 (ETO2) helps recruit the nucleosome remodeling and deacetylase (NuRD) complex to the globin locus. Furthermore, ETO2 regulates hematopoietic differentiation and is a potential therapeutic target for acute leukemia. In this work, we identify critical interactions between ETO2 and the GATA Zn finger domain containing the 2A (GATAD2A) component of NuRD. The ETO2 nervy homology region 4 (NHR4) domain interacts with multiple polyproline-leucine motifs within GATAD2A. We demonstrate that oligomerization of the ETO2 nervy homology region 3 (NHR3) enhances its affinity for peptides containing at least two polyproline-leucine motifs. Replacing the native motifs from GATAD2A with a higher-affinity sequence from known-binder N-CoR markedly enhances binding affinity, yielding a peptide that disrupts the interaction between ETO2 and target proteins. Enforced peptide expression elevates γ-globin expression levels and induces differentiation of HUDEP-2 and K562 cells. These findings provide insight into ETO2-mediated recruitment of co-regulatory proteins and yield a novel approach for ETO2 inhibition through multivalent binding of the NHR4 domain.


Conflict of interest statement

None declared.

Figures

Graphical Abstract
Graphical Abstract
Figure 1.
Figure 1.
15N-HSQC chemical shift perturbation experiments show that the individual (M) PPPL motifs weakly bind to ETO2-NHR4. (A) ETO2 contains four conserved Nervy Homology Regions (NHR1, NHR2, NHR3, and NHR4). GATAD2A contains two highly Conserved Regions (CR1 and CR2), with an intervening region containing four neighboring polyproline-leucine motifs ( (M)PPPL), as shown in the amino acid sequence of this region. (B) 2D 15N-HSQC spectra of 15N-ETO2-NHR4 show that titration of GATAD2A-MPPPL-3 induces chemical shift changes throughout the spectrum, which is highlighted for W585 (inset). (C) The chemical shift perturbation data for 12 resonances were fit simultaneously to determine dissociation constants (KD) for PPPL-1, PPPL-2, MPPL-3, and PPPL-4. (D) Chemical shift perturbation data for (M)PPPL-1 and (P)PPPl-3 show that interchanging the first proline or methionine of the binding motifs with methionine or proline, respectively, reduces the binding affinity for each.
Figure 2.
Figure 2.
Solution structure of ETO2-NHR4 bound to MPPPL-3. (A) A diagram depicts the ETO2-NHR4-MPPLsc fusion used for this structural analysis. (B) 2D 15N-HSQC spectrum of 13C,15N-ETO2-NHR4-MPPLsc with insets showing titration spectra for G569, W585, A573, and H590 resonances (dark blue represents 15N-ETO2-NHR4-MPPLsc, and maroon, green, light blue, red, and gray represent titration of MPPL-3 into 15N-ETO2-NHR4). (C) The solution structure of ETO2-NHR4-MPPLsc shows the MPPL-3 peptide (cyan) adopts a polyproline-II helical structure that binds in a groove on the surface of the NHR4 domain, with the first methionine (M244) interacting with the conserved tryptophan (W585) and the leucine (L247) binding in a deep pocket, the base of which is formed by a tyrosine (Y575). (D) An expanded view of the binding interface shows that the Cformula image and Cformula image atoms of M244 and the Cformula image and Cformula image atoms of P245 pack against the pyrrole and benzene portions of W585, respectively.
Figure 3.
Figure 3.
In-cell binding analysis between ETO2 and the GATAD2A (M) PPPL region. (A) A diagram depicts the different NanoLuc (NL) and HaloTag (HT) constructs for binding analysis by bioluminescence resonance energy transfer (NanoBRET). Six different (M)PPPL constructs were designed, including two with the NL donor tag on the C-termini (one including the neighboring CR1 domain as a coiled-coil single chain sequence on the N-terminus, see Materials and methods). The remaining four (M)PPPL constructs contain the NL tag on the N-terminus to allow for C-terminal truncation while maintaining the same relative position of the NL tag. Three ETO2 C-terminal HT constructs were designed to maintain the same relative position of the HT acceptor tag. (B) The interaction between ETO2-NHR4 and sc (M)PPPLx4 yields a strong BRET intensity, which progressively increases with the inclusion of the NHR3 and NHR2 domains. Mutating the key tryptophan residue that interacts with the first proline of the PPPL motif (M585A) markedly decreases the BRET signal with all ETO2-HT constructs. (C) Truncating the PPPLx4 progressively reduces the observed BRET signal. (D) Introducing mutations to the ETO2-NHR2 tetramerization domain that disrupt tetramerization (M7) or dimerization (M5) decreases the BRET signal intensity (P values reflect a comparison with the equivalent wild-type interaction). (E) A diagram shows the M5 and M7 mutations in the ETO2-NHR2 tetramerization domain. All measurements were performed in quadruplicate and repeated at least twice to confirm the results. P-values (<0.05=* and <0.01=**) were determined by the Student’s T-test with Welch’s correction.
Figure 4.
Figure 4.
In vi tro binding affinity analysis of the multivalent interaction between ETO2 and GATAD2A. (A) A diagram depicts the various (M)PPPL peptides and ETO2 protein constructs for binding analysis. (B) The peptide amino acid sequences are shown for PPPLx4, PPPLx2A, (M)PPPLx2B, and (M)PPPLx2C. (C)The ITC binding isotherms and associated fit to a one-site binding model are shown for (M)PPPLx4 (125 μM) titrated into ETO2-NHR4 or ETO2-NHR3-4 (50 μM) and (D) PPPLx2A, (M)PPPx2B, and (M)PPPLx2C peptides (250 μM) titrated into ETO2-NHR3-4 (50 μM). The reported dissociation constants (KD) are the average and standard deviation for 2–3 repeated measurements (see Supplemental Figs S3 and S4).
Figure 5.
Figure 5.
ETO2-NHR3-4 is predicted to form an antiparallel tetramer. (A) ETO2-NHR3-4 elutes from a size exclusion column (Superdex75 Increase 10/300, Cytiva) at progressively earlier volumes with increasing concentration of injectant (25, 100, and 500 μM). At the highest concentration, it elutes at a similar position to the Zmynd8 tetramer (25 μM). (B) AlphaFold2-multimer models the ETO2-NHR3-4 tetramer as an antiparallel dimer of dimers with predicted local distance difference test (pLDTT) scores in the 70–90 range. The two dimers interact through a well-defined interface (pLDDT = 74 and 75, PAE = 3.7 and 5.1) to form an anti-parallel tetramer (highlighted in red and blue). Extending from the tetrameric interface is a less defined region (pLDTT = 64, PAE = 3.9 A) where the helices interact as parallel dimers (highlighted in orange). (C) The AlphaFold2-multimer model of the complex between ETO2-NHR3-4 and PPPLx2A and (M)PPPLx2C shows that the bivalent peptides bind to opposite ends of the tetramer, although with much lower confidence scores.
Figure 6.
Figure 6.
Developing a high-affinity multivalent peptide ligand. (A) A diagram depicts the N-CoRx4, N-CoRx2A, N-CoRx2B, and N-CoRx2C peptides and their respective sequences. (B) The ITC binding isotherms and associated fit to a one-site binding model are shown for the N-CoRx2A peptides (250 μM) titrated into ETO2-NHR3-4 (50 μM). The reported dissociation constants (KD) are the average and standard deviation for 2–3 repeated measurements (see Supplementary Fig. S6). (C) N-CoRx2A and ETO2-NHR3-4 were combined at 1:2 and 1:1 molar ratios and analyzed by size exclusion chromatography (Superdex-75 Increase 10/300, Cytiva). The mixture of N-CoRx2A and ETO2-NHR3-4 (1:2 molar ratio) elutes earlier than the individual components, consistent with complex formation. With excess N-CoRx2A (1:1 molar ratio), an additional peak elutes at elutes at a position corresponding to unbound N-CoRx2A. (D) N-CoRx4 was combined with ETO2-NHR3-4 at a 1:4 and 1:2 ratio and analyzed by size exclusion chromatography (Superdex-75 Increase 10/300, Cytiva). The complex formed between N-CoRx4 and ETO2-NHR3-4 (1:2 molar ratio) elutes at a similar position as N-CoRx2A and ETO2-NHR3-4 (1:2 molar ratio). However, the complex formed between N-CoRx4 and ETO2-NHR3-4 (1:4 molar ratio) elutes at an earlier position (cyan), indicating the formation of a larger oligomeric species.
Figure 7.
Figure 7.
Stabilizing the homo-tetrameric ETO2-NHR3 coiled-coil complex. (A) 2D 15N-HSQC spectra of the isolated 15N-ETO2 coiled-coil region (residues 480–536) show that the A501L and V497I/A501L mutations markedly improve peak resolution and spectral dispersion. (B) Circular dichroism spectra of the wild-type and mutant ETO2 coiled-coil region show that these mutations increase helical content from 29% (wild-type) to 73% (A501L) and 84% (V497/A501L) (C) The ETO2-NHR3-4 (V497I/A501L) mutation markedly improves the overall confidence of the AlphaFold2-multimer model, with pLDDT scores at the tetrameric interface >90 (compare to Fig. 5B). (D) The ITC binding isotherms and associated fit to a one-site binding model are shown for the PPPLx2A and N-CoRx2A peptides (250 μM) titrated into ETO2-NHR3-4 (V497I/A501L) (50 μM). The reported dissociation constants (KD) are the average and standard deviation for two repeated measurements (see Supplementary Fig. S8). (E) The complexes formed between N-CoRx2A (60 μM) and ETO2-NHR3-4 (WT) or ETO2-NHR3-4 (V497I/A501L) (120 μM) were analyzed by SEC-MALS. Red horizontal lines are shown at the approximate molecular weights for a dimer (35 kDa), tetramer (75 kDa), and octamer (150 kDa). The sloping molar mass for the wild-type protein indicates a dynamic equilibrium among states. In contrast, the relatively flat molar mass for ETO2-NHR3-4 (V497I/A501L) + N-CoRx2A indicates a more stable complex. Hence, the V497I/A501L mutation stabilizes the formation of the complex, eluting as a single peak with a molecular weight appropriate for a tetramer.
Figure 8.
Figure 8.
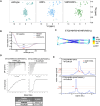
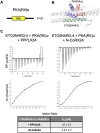
Disrupting tetramerization by the ETO2-NHR3 domain reduces binding affinity for multivalent ligands. (A) A diagram depicts the PKA (RII)α domain used for these studies. (B) A ribbon diagram illustrates the structure of the complex between PKA (RII)α dimer (red and blue) and the AML1-ETO-NHR3 domain (green, PDB ID: 2KYG) aligned with the ETO2-NHR3 tetramer model (white), which shows that PKA (RII)α binds to the predicted tetrameric interface. (C) The ITC binding isotherms and associated fit to a one-site binding model are shown for the PPPLx2A (see Fig. 4A) and N-CoRx2A (see Fig. 6A) peptides (250 μM) titrated into ETO2-NHR3-4 (50 μM) in the presence of PKA (RII)α (100 μM). The reported dissociation constants (KD) are the average and standard deviation for two repeated measurements (see Supplementary Fig. S9).
Figure 9.
Figure 9.
Enforced expression of N-CoRx2A induces g-globin gene expression and differentiation in HUDEP-2 cells. (A) Q-PCR results show the γ/ (γ + β) ratio of mRNA in HUDEP-2 cells expressing N-CoRx2A peptide. (B) and (C) Q-PCR results of γ-globin and β-globin mRNA, respectively. (D) Q-PCR results of CD235 mRNA in N-CoRx2A peptide expressing HUDEP-2 cells. The results are shown as the mean ± SD, n = 3. P value was calculated by one-way ANOVA. *P < 0.05, **P < 0.01, ***P < 0.001, ****P < 0.0001. (E) Co-immunoprecipitation shows the interaction of expressed Flag-tagged N-CoRx2A with endogenous ETO2 in HUDEP-2 cells.
Figure 10.
Figure 10.
Model of ETO2 oligomerization in transcription regulation. (A) ETO2 forms a stable tetramer through its NHR2 domain (light blue). Binding to a multivalent ligand (PPPLx2) stabilizes antiparallel tetramer formation of the NHR3-4 domains (purple). At high density, the combination of stable (NHR2) and dynamic (NHR3) tetrameric domains leads to the formation of large arrays of the ETO2 tetramer. (B) When ETO2 (purple) is recruited by transcription factor complexes to a genetic locus at sufficient density, it can start forming these arrays that recruit more co-regulatory protein complexes (e.g. NuRD, N-CoR, and SMRT), ultimately leading to a large silencing complex and compacted chromatin.

References

    1. Fujiwara T, Lee H-Y, Sanalkumar R et al. Building multifunctionality into a complex containing master regulators of hematopoiesis. Proc Natl Acad Sci USA. 2010; 107:20429–34. 10.1073/pnas.1007804107. - DOI - PMC - PubMed
    1. Goardon N, Lambert JA, Rodriguez P et al. ETO2 coordinates cellular proliferation and differentiation during erythropoiesis. EMBO J. 2006; 25:357–66. 10.1038/sj.emboj.7600934. - DOI - PMC - PubMed
    1. Guo X, Plank-Bazinet J, Krivega I et al. Embryonic erythropoiesis and hemoglobin switching require transcriptional repressor ETO2 to modulate chromatin organization. Nucleic Acids Res. 2020; 48:10226–40. 10.1093/nar/gkaa736. - DOI - PMC - PubMed
    1. Hoang T, Lambert JA, Martin R SCL/TAL1 in hematopoiesis and cellular reprogramming. Curr Top Dev Biol. 2016; 118:163–204. - PubMed
    1. Davis JN, McGhee L, Meyers S The ETO (MTG8) gene family. Gene. 2003; 303:1–10. 10.1016/S0378-1119(02)01172-1. - DOI - PubMed

MeSH terms

Substances