. 2025 Jun 4;16(11):2128-2140.
doi: 10.1021/acschemneuro.5c00236. Epub 2025 May 27.

Mechanisms of Alpha-Synuclein-Seeded Aggregation in Neurons Revealed by Fluorescence Lifetime Imaging

Affiliations

Mechanisms of Alpha-Synuclein-Seeded Aggregation in Neurons Revealed by Fluorescence Lifetime Imaging

Paula-Marie E Ivey et al. ACS Chem Neurosci. .

Abstract

The brains of Parkinson's disease (PD) patients are characterized by the presence of Lewy body inclusions enriched with fibrillar forms of the presynaptic protein alpha-synuclein (aSyn). Despite related evidence that Lewy pathology spreads across different brain regions as the disease progresses, the underlying mechanism, and hence the fundamental cause of PD progression, is unknown. The propagation of aSyn pathology is thought to potentially occur through the release of aSyn aggregates from diseased neurons, their uptake by neighboring healthy neurons via endocytosis, and subsequent seeding of native aSyn aggregation in the cytosol. A critical aspect of this process is believed to involve the escape of internalized aggregates from the endolysosomal compartment, though direct evidence of this mechanism in cultured neuron models remains lacking. In this study, we utilize a custom-built, time-gated fluorescence lifetime imaging microscopy (FLIM) system to investigate the progression of seeded aggregation over time in live cortical neurons. By establishing fluorescence lifetime sensitivity to aSyn aggregation levels, we are able to monitor the protein's aggregation state. Through a FLIM analysis of neurons expressing aSyn-mVenus and exposed to aSyn preformed fibrils labeled with the acid-responsive dye pHrodo, we reveal the protein's aggregation state in both the cytosol and the endolysosomal compartment. The results indicate that aSyn seeds undergo partial disassembly prior to escaping the endocytic pathway and that this escape is closely linked to the aggregation of cytosolic aSyn. In certain neurons, monomeric aSyn is found to translocate from the cytosol into the endolysosomal compartment, where it apparently forms aggregates in proximity to retained seeds. Additional analyses reveal zones of neuritic aSyn aggregates that overlap with regions of microtubule disruption. Collectively, these findings enhance our understanding of aSyn pathology propagation in PD and other synucleinopathies, motivate additional experiments along these lines, and offer a path to guide the development of disease-modifying therapies.

Keywords: Parkinson’s disease; alpha-synuclein; fluorescence lifetime imaging microscopy; live-cell imaging; neurodegenerative diseases; protein aggregation.


Figures

1
1
Illustration of the principle of fluorescence lifetime reduction due to aSyn aggregation. As aSyn tagged with a fluorescent dye or protein aggregates, the local concentration of the fluorophore increases, leading to a decrease in fluorescence lifetime through a self-quenching mechanism. This reduction in lifetime is represented by a color gradient shifting from blue (monomeric state) to red (fibrillar state).
2
2
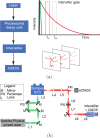
(a) The FLIM measurement principle. An intensifier gate incrementally samples the fluorescence decay curve (red), and a picosecond delay unit changes the temporal gate delay relative to the laser excitation pulse (green). At each gate delay position, an image is generated that is utilized to determine lifetime information in each pixel of the image. (b) Schematic of the time-domain FLIM system used for detecting aggregation (top view, not drawn to scale). A Spectra-Physics ultrafast laser and optical parametric amplifier system (Spirit HE 1040–16 pump with OPA 30, yielding approximately 150 fs pulses) provides the excitation (green) which is coupled to an Olympus IX73 microscope via a set of lenses and mirrors. The emission path from the microscope is depicted in red. L: lens, M: mirror, PS: periscope, FM: flip mirror, CMOS (complementary metal-oxide-semiconductor) camera, and sCMOS (scientific CMOS) camera.
3
3
A decrease in aSyn-mVenus lifetime is observed in fixed neurons following PFF treatment. (a–c) Representative lifetime maps for rat cortical neurons expressing aSyn-mVenus, fixed and imaged 6 days after incubation without (a) or with (b, c) aSyn PFFs. The neurons were fixed without (a, b) or with (c) Triton X-100 (1%, v/v). Scale bars in panels (a–c): 20 μm. (d) Graph showing the fluorescence lifetime for the control versus PFF-treated neurons, fixed without exposure to 1% (v/v) Triton X-100 (n = 22 neurons from 3 independent cultures per group), indicating a significant reduction in lifetime for the PFF-treated samples. The data are shown as box plots (p < 0.0001, unpaired t-test).
4
4
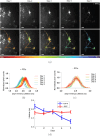
A gradual decrease in aSyn-mVenus lifetime is observed in live neurons exposed to PFFs. (a) Intensity images (top) and lifetime maps (bottom) of representative live cortical neurons expressing aSyn-mVenus, recorded from 3 to 7 days post-PFF treatment (identified as Day 1 through Day 5). In the intensity images (top), two neurons display aggregate formation over time, evidenced by the dashed intensity structures along the axons. Corresponding lifetime maps (bottom) reveal a concomitant decrease in lifetime with aggregate formation. Scale bars: 20 μm. (b, c) Lifetime histograms over 5 days for neurons cultured in the presence (b) or absence (c) of aSyn PFFs. The histograms show lifetime distributions across all pixels contained within neurons (20 neurons from 2 independent cultures). The data are presented as the mean ± SEM (SEM: standard error in the mean, σ/n , with σ being equal to the standard deviation for each sample and n = 20). (d) Line graph showing the mean lifetime trends over 5 days for the lifetime histograms in (b) and (c); the error bars represent the SEM.
5
5
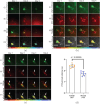
PFF escape from the endolysosomal compartment precedes seeded aggregation. (a) Images of representative live cortical neurons transduced with adenovirus encoding aSyn-mVenus and treated with pHrodo-labeled aSyn PFFs, recorded 6 days post-PFF treatment. The images display the fluorescence intensity of aSyn-mVenus (i) and pHrodo (ii), the merged intensity signals (iii), and the corresponding aSyn-mVenus lifetime map (iv) of neurons showing evidence of seed retention (top row) or escape (bottom rows, Escape (i) and (ii)). Scale bar: 10 μm. (b) Graph showing the aSyn-mVenus fluorescence lifetime for neurons with retained or escaped PFFs (n = 12 neurons), indicating a significant reduction in lifetime for neurons with escaped seeds. The data are shown as box plots (p < 0.000001, unpaired t-test).
6
6
PFF retention is generally (but not always) associated with a lack of seeded aggregation. (a–c) Images of representative live cortical neurons transduced with adenovirus encoding aSyn-mVenus and treated with pHrodo-labeled aSyn PFFs, recorded from 3 to 5 days (identified as Day 1 through Day 3) (a) or 3 to 6 days (identified as Day 1 through Day 4) (b, c) post-PFF treatment. The images depict the fluorescence intensity of aSyn-mVenus (i) and pHrodo (ii), the merged intensity signals (iii), and the corresponding aSyn-mVenus lifetime map (iv) of neurons showing evidence of seed escape after treatment with A53T aSyn PFFs (a), or seed retention after treatment with mouse aSyn PFFs (b, c). (a, c) aSyn-mVenus aggregation with the white arrows in (c) highlighting that the site of aggregation coincided with PFF-pHrodo inclusions, indicating endolysosomal aggregation. (b) A lack of aSyn-mVenus aggregation. Scale bars in (a–c): 15 μm. (d) Graph showing the aSyn PFF-pHrodo fluorescence lifetime for neurons treated with human A53T aSyn PFFs at the final time point before escape or mouse aSyn PFFs on the final day of retention (n = 7 neurons), indicating a significantly lower lifetime for neurons treated with mouse aSyn PFFs. The data are shown as the mean ± SEM (p < 0.000005, unpaired t-test).
7
7
aSyn aggregates disrupt the microtubule network in neurons treated with aSyn PFFs. Rat cortical neurons expressing aSyn-mVenus were incubated in the absence (’control’, top row) or presence (middle and bottom rows) of human A53T aSyn PFFs for 6 days. The cells were fixed 6 days post-PFF treatment, stained with a primary antibody specific for β-tubulin and an Alexa Fluor 594-conjugated secondary antibody, and imaged. The panels depict the fluorescence intensity of aSyn-mVenus and Alexa Fluor 594 alongside the merged intensity signals. White arrows indicate regions in the soma (middle row) or processes (bottom row) of representative PFF-treated neurons with apparent aSyn-mVenus aggregates, accompanied by a corresponding loss of β-tubulin-Alexa 594 signal. Scale bar: 10 μm.
8
8
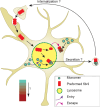
Model illustrating the major findings of this study. aSyn PFFs (shown as a red multisubunit assembly at the top) are internalized via endocytosis and trafficked to the lysosome. Within the lysosome, PFFs undergo partial dissociation, represented by the fragmentation of the red assembly. Smaller PFF fragments exit the lysosome (indicated by a purple arrow denoting endocytic escape) and recruit cytosolic aSyn monomers (depicted as blue spheres). This interaction promotes seeded aSyn aggregation and, in aSyn-mVenus-expressing cells, results in a decrease in fluorescence lifetime, visualized as a blue-to-red color gradient shift. Conversely, larger PFF fragments are retained in the lysosome but can recruit monomeric aSyn transported into this compartment (potentially via chaperone-mediated autophagy). This recruitment leads to seeded aSyn aggregation in the lysosome and, in aSyn-mVenus-expressing cells, a corresponding decrease in aSyn-mVenus lifetime within this compartment. aSyn aggregates formed in the endolysosomal compartment may be released from the neuron, potentially via autophagic or lysosomal secretion. In turn, the secreted aggregates could be internalized by neighboring neurons, contributing to the propagation of pathology.

Update of

Similar articles

References

    1. Goedert M., Clavaguera F., Tolnay M.. The propagation of prion-like protein inclusions in neurodegenerative diseases. Trends Neurosci. 2010;33:317–325. doi: 10.1016/j.tins.2010.04.003. - DOI - PubMed
    1. Jaunmuktane Z., Brandner S.. Invited Review: The role of prion-like mechanisms in neurodegenerative diseases. Neuropathol. Appl. Neurobiol. 2020;46:522–545. doi: 10.1111/nan.12592. - DOI - PMC - PubMed
    1. Meisl G., Knowles T. P., Klenerman D.. The molecular processes underpinning prion-like spreading and seed amplification in protein aggregation. Curr. Opin. Neurobiol. 2020;61:58–64. doi: 10.1016/j.conb.2020.01.010. - DOI - PubMed
    1. Grozdanov V., Danzer K. M.. Release and uptake of pathologic alpha-synuclein. Cell Tissue Res. 2018;373:175–182. doi: 10.1007/s00441-017-2775-9. - DOI - PubMed
    1. Dobson C. M.. Principles of protein folding, misfolding and aggregation. Semin. Cell. Dev. Biol. 2004;15:3–16. doi: 10.1016/j.semcdb.2003.12.008. - DOI - PubMed

LinkOut - more resources