

Multiparametric quantitative magnetic resonance imaging of skeletal muscle in CKD
- PMID: 40421837
- PMCID: PMC12208609
- DOI: 10.1152/ajprenal.00254.2024
Multiparametric quantitative magnetic resonance imaging of skeletal muscle in CKD
Abstract
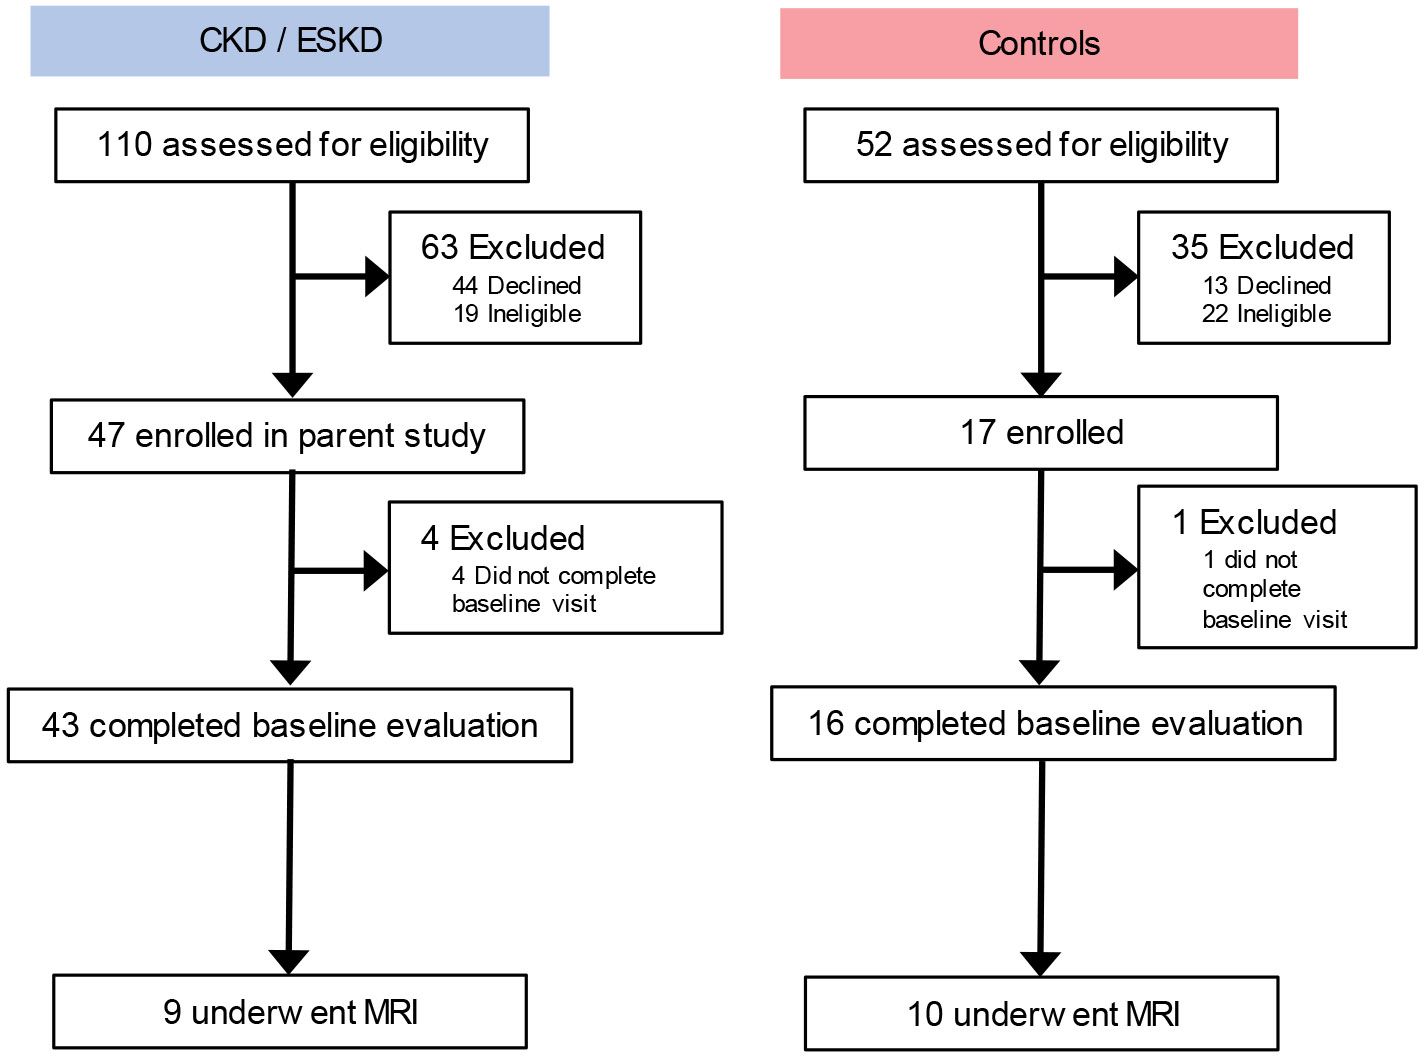
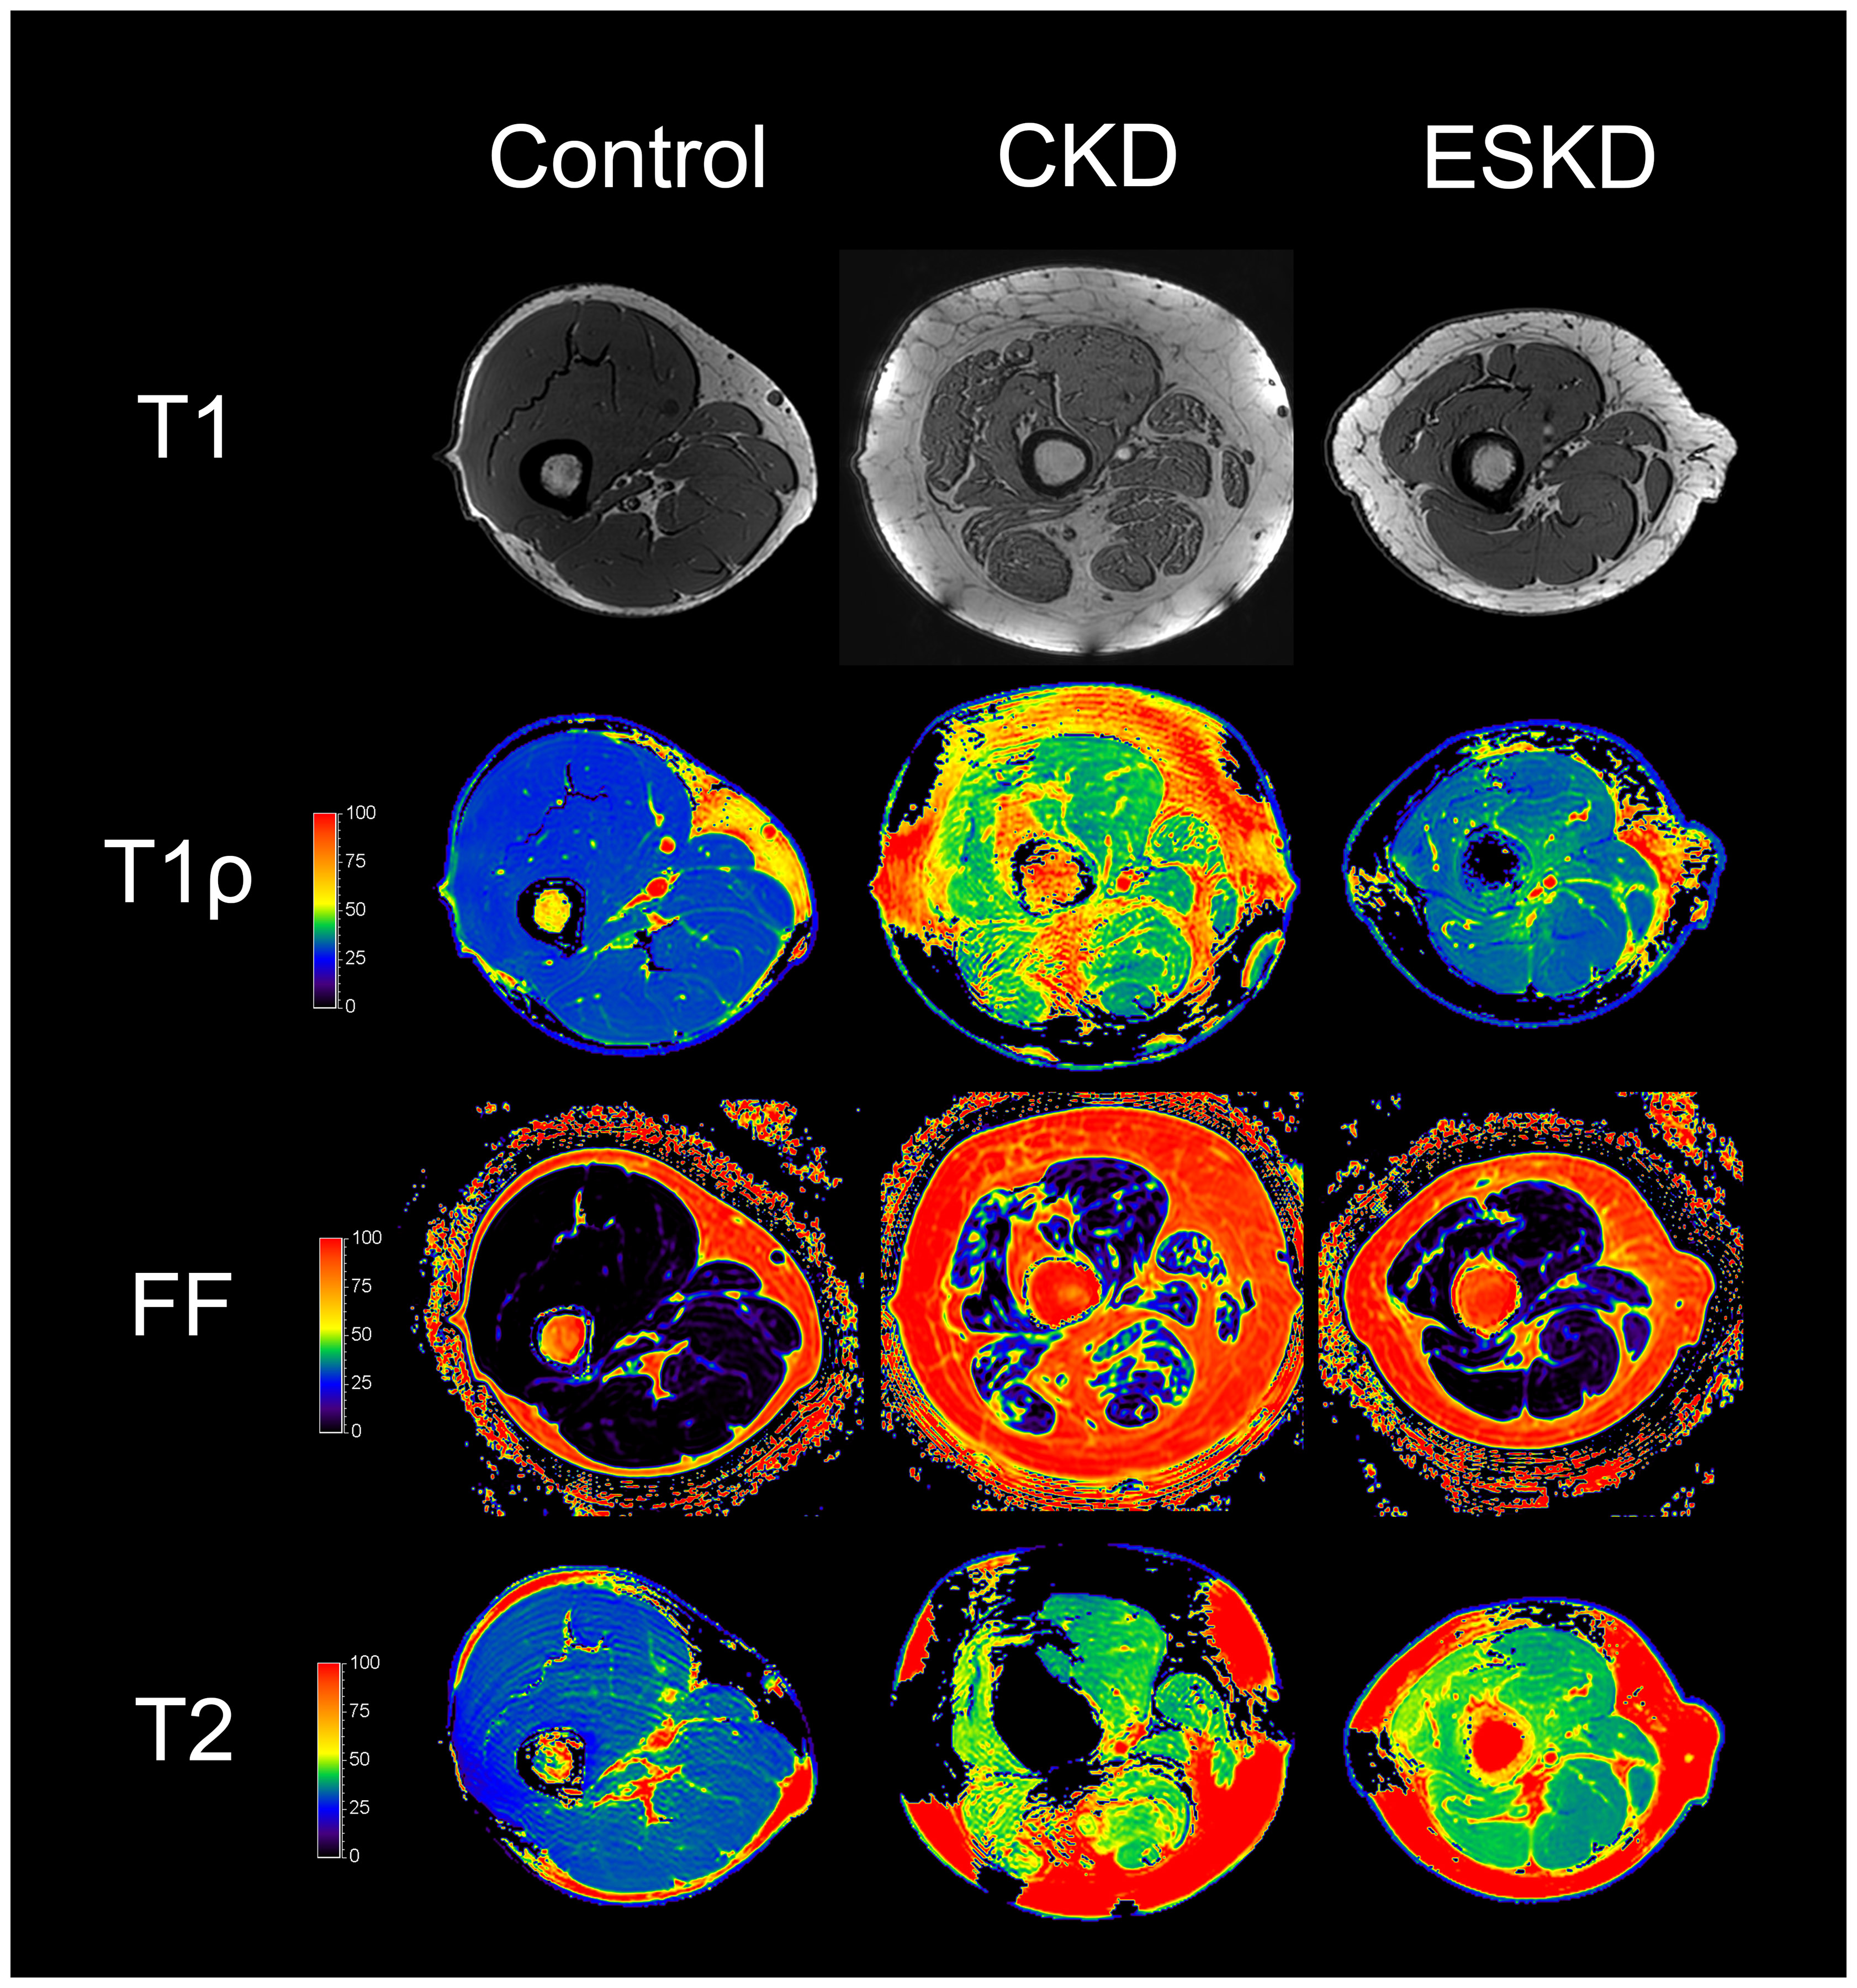
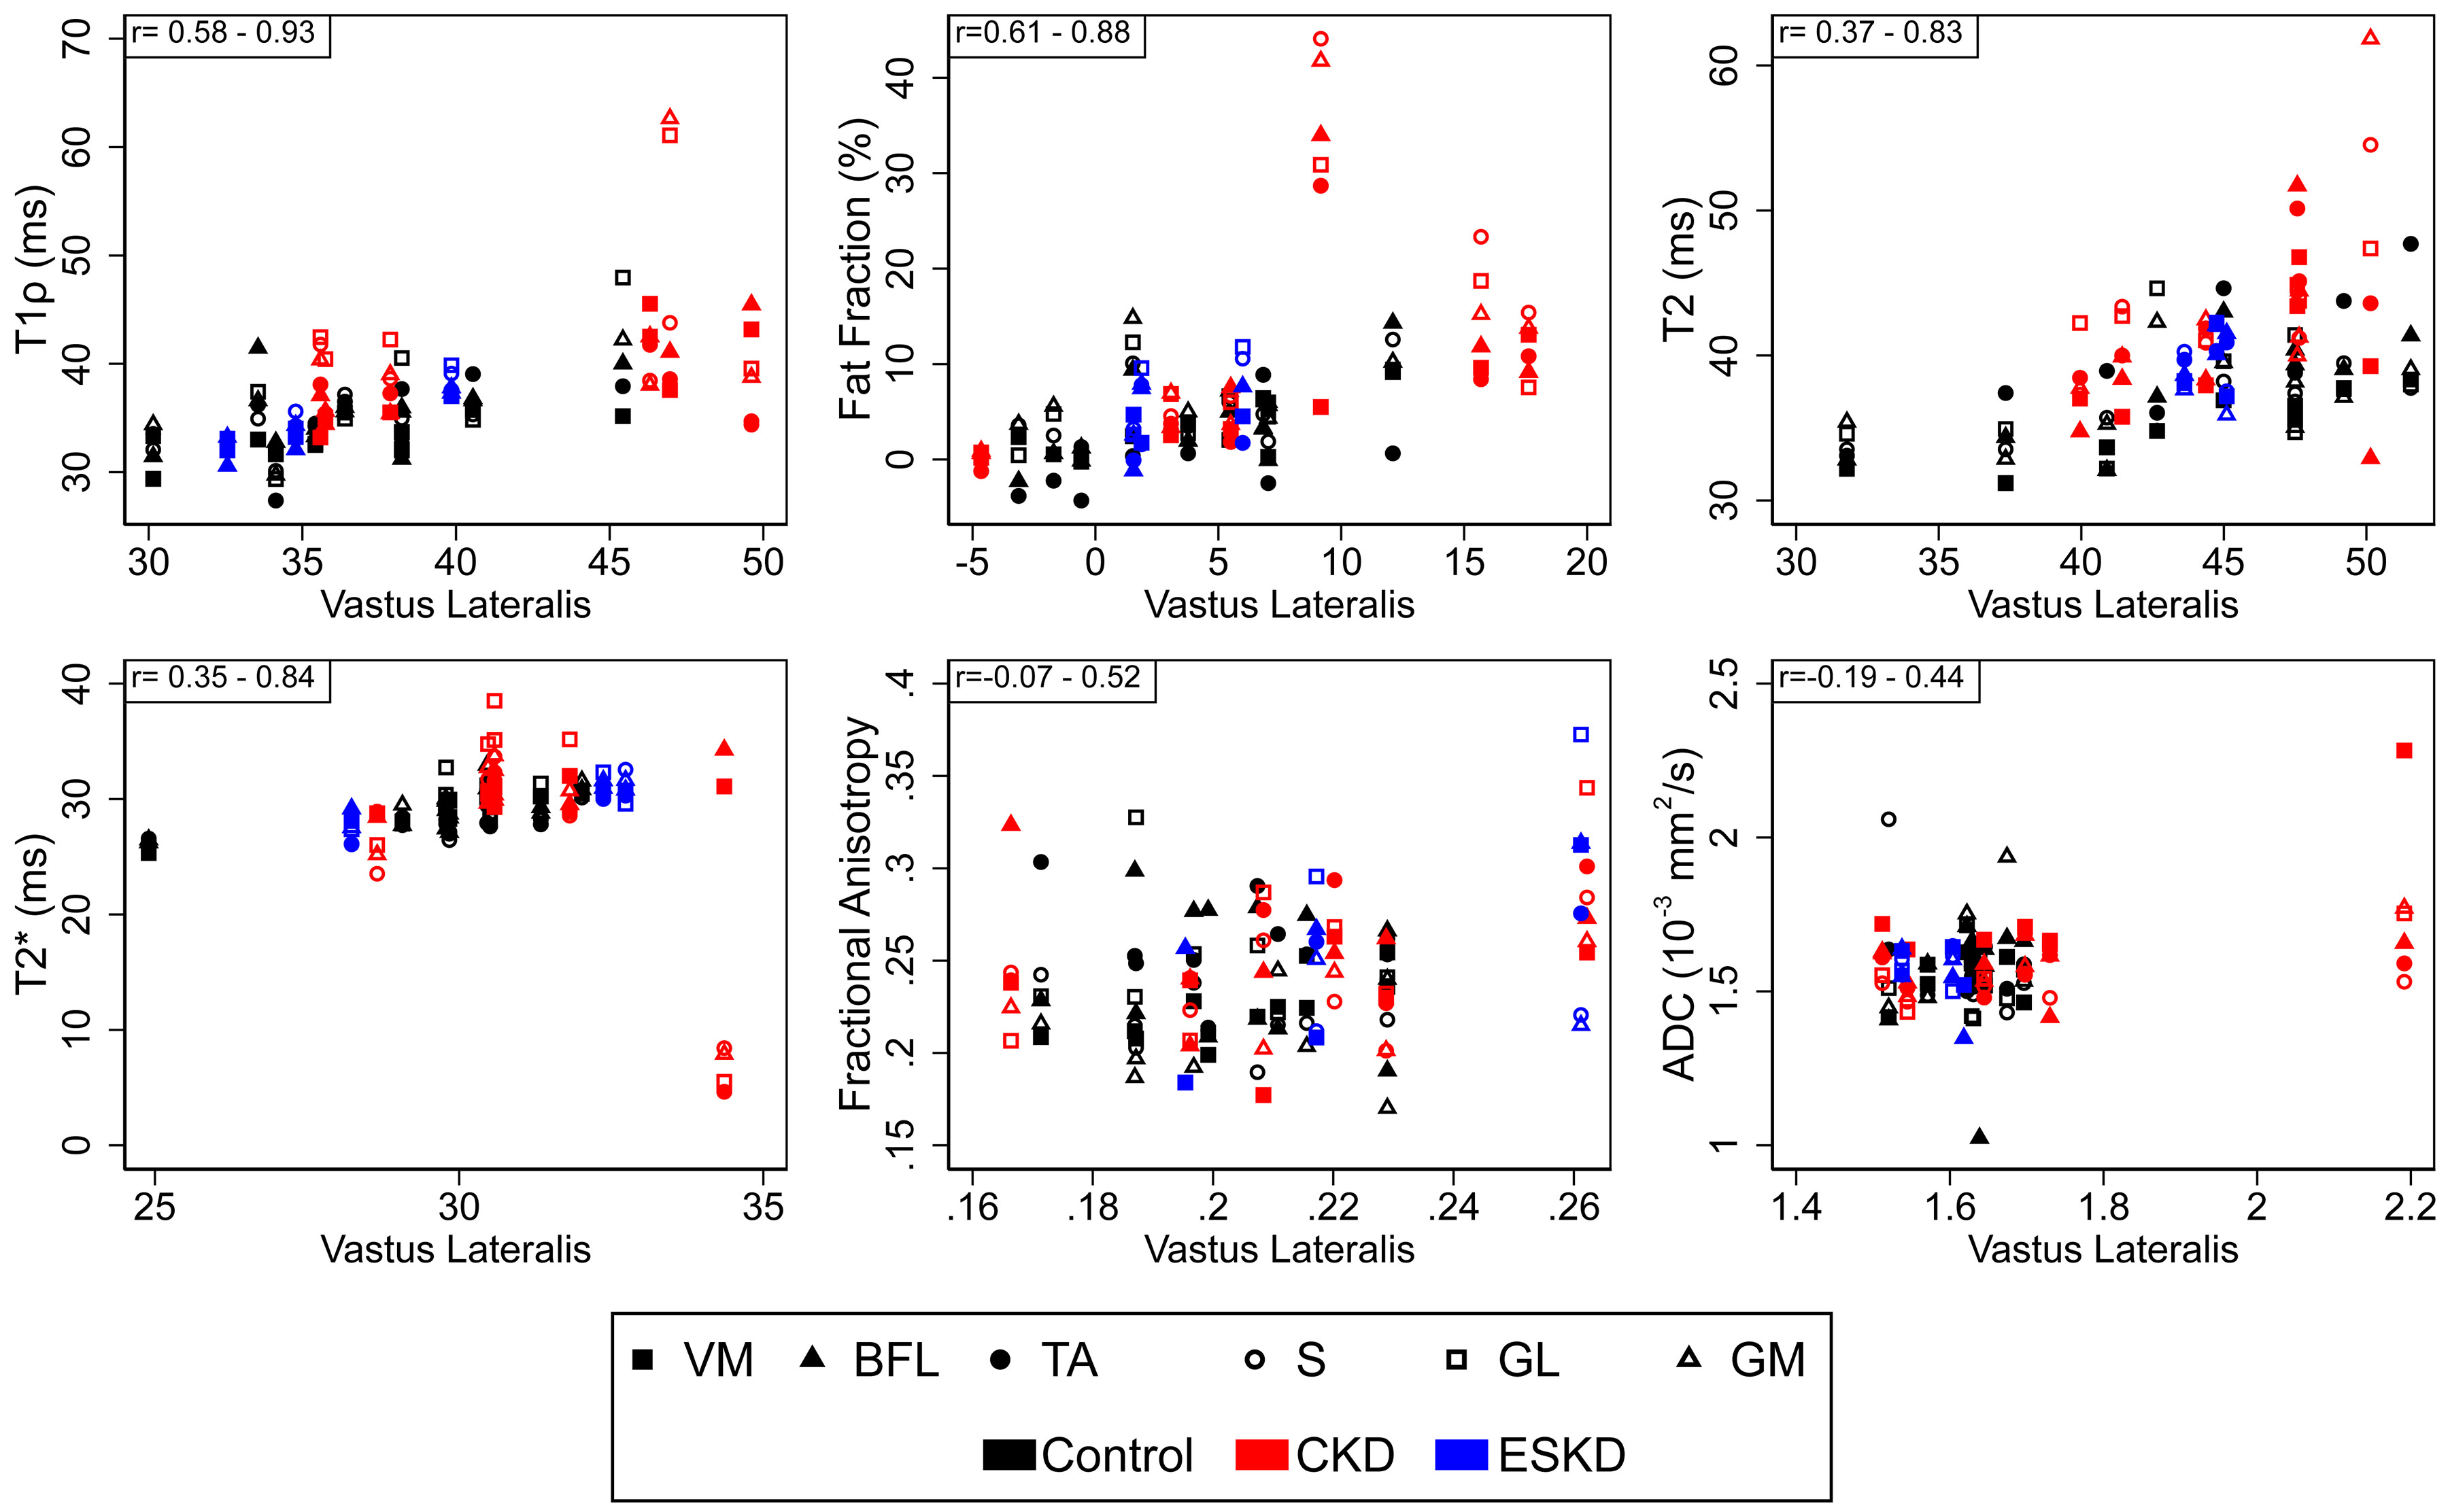
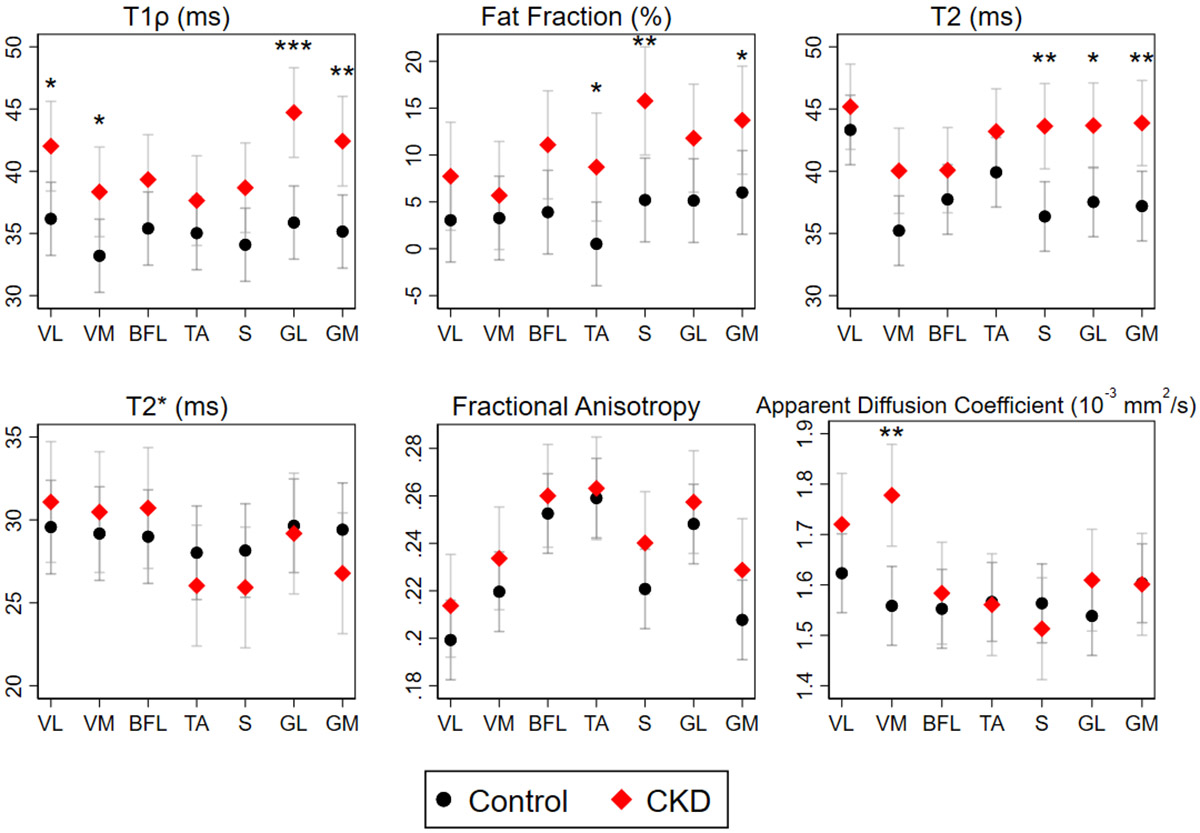
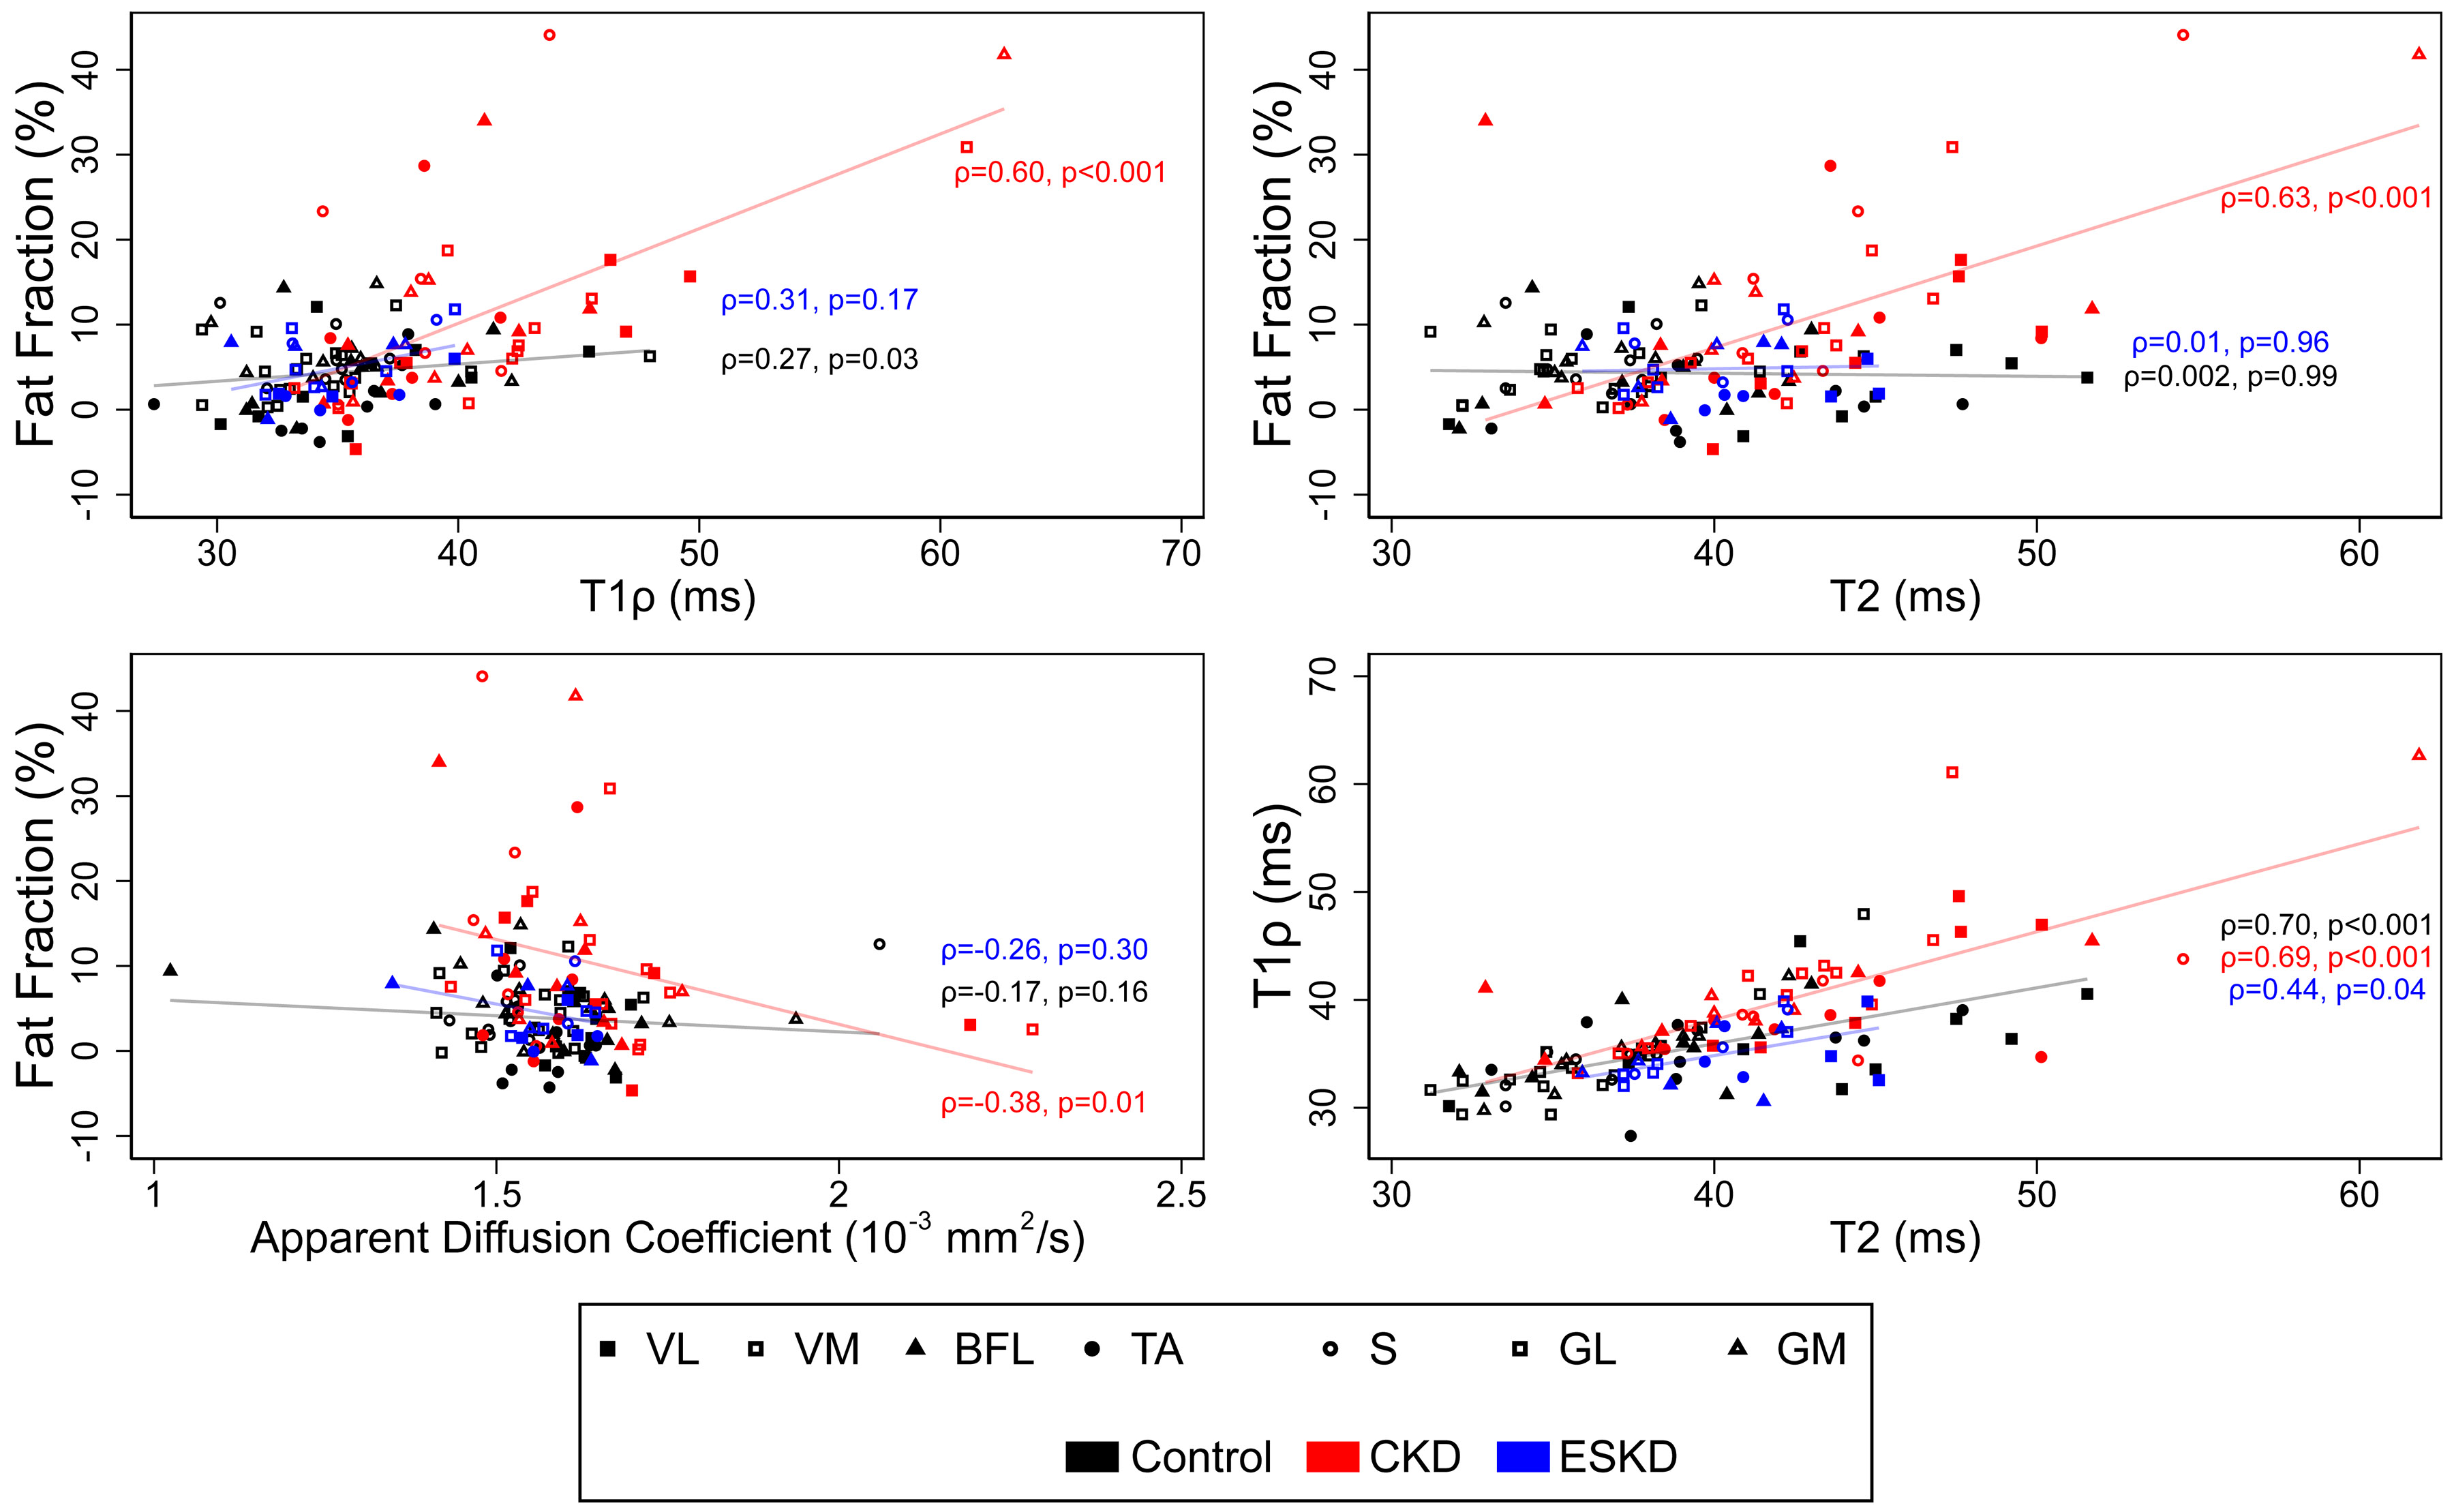
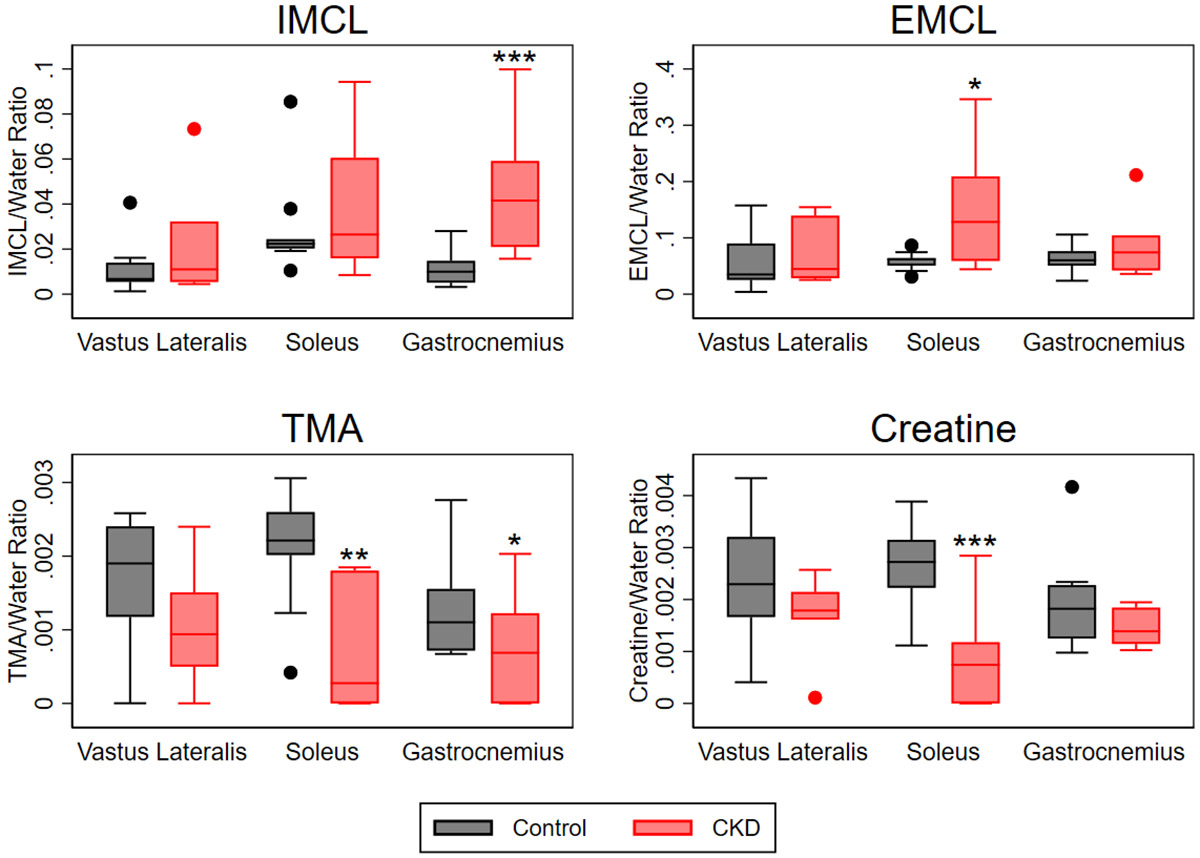
Skeletal muscle dysfunction causes functional decline and disability in patients with chronic kidney disease (CKD). Identification of muscle pathology before significant loss of physical function would be a major advance. Multiparametric, quantitative magnetic resonance imaging (qMRI) of seven leg muscle groups (3 thigh and 4 calf) was conducted in patients with CKD stages 4-5 (n = 6), end-stage kidney disease (ESKD, n = 3), and healthy controls (n = 10) using a 3 Tesla MRI scanner. Measurements included T1 relaxation time in the rotating frame (T1ρ) and transverse relaxation time (T2) mapping, Dixon imaging of intramuscular fat content, diffusion tensor imaging (DTI) for muscle structure, and 1H-MR spectroscopy for intra- and extra-myocellular lipid (IMCL and EMCL, respectively) and physiologically relevant muscle metabolites. T1ρ and T2 times were prolonged and fat fraction (FF) was higher in patients with CKD compared with controls (differences of 4.99 ms (95% CI 1.71-8.27), 6.72 ms (95% CI 3.78-9.66), and 6.67% (95% CI 0.65-12.68), respectively). T1ρ and FF were similarly elevated across muscle groups, whereas T2 differences may have been greater in calf muscles. T1ρ and T2 were lower in patients with ESKD compared with CKD and similar to controls, consistent with prior histologic assessment of muscle fibrosis. No significant differences by CKD status were observed for DTI parameters. Compared with controls, IMCL was higher in patients with CKD, and trimethylamine and creatine concentrations were lower. In sum, multiparametric qMRI of skeletal muscle in patients with CKD noninvasively identified differences in metrics associated with fibrosis, fat infiltration, and metabolic dysregulation.NEW & NOTEWORTHY In this study, we demonstrate that multiparametric, quantitative magnetic resonance imaging (qMRI) can quantify multiple distinct anatomic and pathologic features of skeletal muscle pathology in patients with CKD before significant functional decline. qMRI metrics of fibrosis and fat infiltration were elevated, and muscle metabolite concentrations were reduced, in patients with CKD compared with controls. This noninvasive approach offers a valuable alternative to traditional muscle biopsies for evaluating muscle health in patients with CKD.
Keywords: MRI; chronic kidney disease; sarcopenia; skeletal muscle.
Conflict of interest statement
DISCLOSURES
MKA has consulted for Renibus Therapeutics. None of the other authors has any financial conflicts to disclose.
Figures
References
-
- Diesel W, Emms M, Knight BK, Noakes TD, Swanepoel CR, van Zyl Smit R, Kaschula RO, and Sinclair-Smith CC. Morphologic features of the myopathy associated with chronic renal failure. Am J Kidney Dis 22: 677–684, 1993. - PubMed
MeSH terms
Grants and funding
- R01 AR077042/AR/NIAMS NIH HHS/United States
- K23DK099438/HHS | NIH | National Institute of Diabetes and Digestive and Kidney Diseases (NIDDK)
- R03 DK116023/DK/NIDDK NIH HHS/United States
- P30 CA008748/CA/NCI NIH HHS/United States
- K23 DK099438/DK/NIDDK NIH HHS/United States
- UM1 TR004400/TR/NCATS NIH HHS/United States
- UL1TR002556/HHS | NIH | National Center for Advancing Translational Sciences (NCATS)
- R01AR077042/HHS | NIH | National Institute of Arthritis and Musculoskeletal and Skin Diseases (NIAMS)
- R03DK116023/HHS | NIH | National Institute of Arthritis and Musculoskeletal and Skin Diseases (NIAMS)
- UL1 TR002556/TR/NCATS NIH HHS/United States
- UM1TR004400/HHS | NIH | National Center for Advancing Translational Sciences (NCATS)
LinkOut - more resources
Full Text Sources
Medical