. 2025 Jun 17;10(6):e0019825.
doi: 10.1128/msystems.00198-25. Epub 2025 May 27.

The characteristics of tissue microbiota in different anatomical locations and different tissue types of the colorectum in patients with colorectal cancer

Affiliations

The characteristics of tissue microbiota in different anatomical locations and different tissue types of the colorectum in patients with colorectal cancer

Lei Liu et al. mSystems. .

Abstract

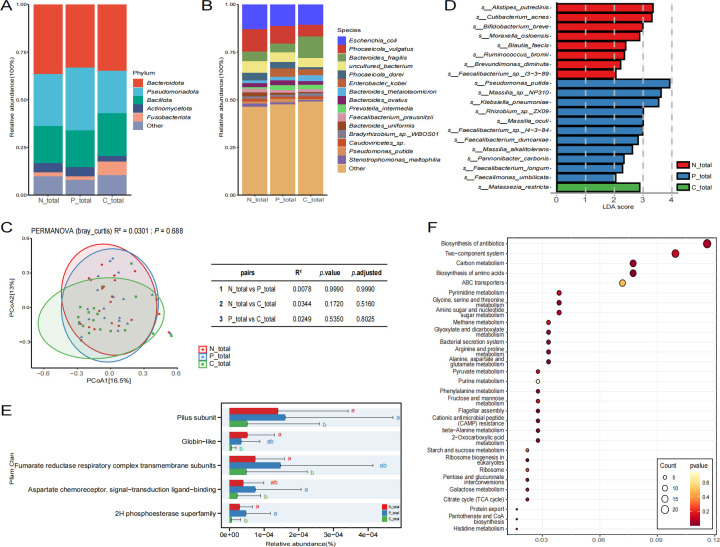
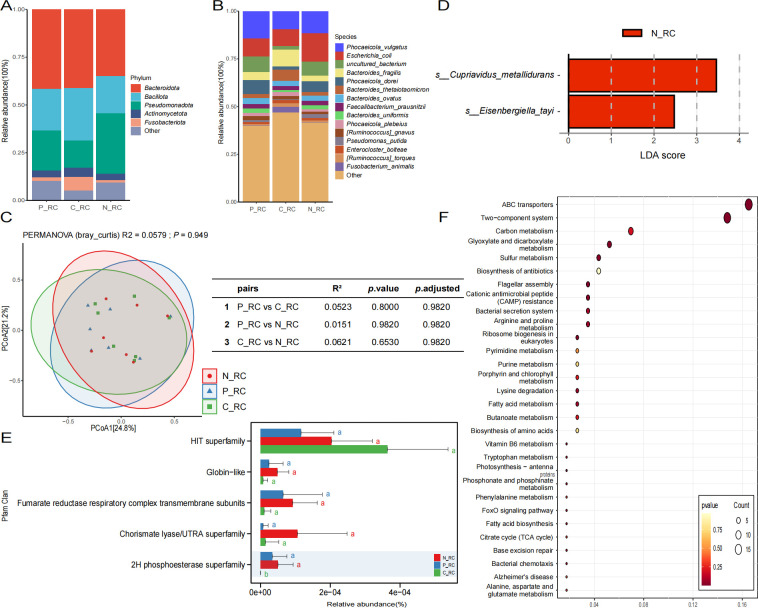
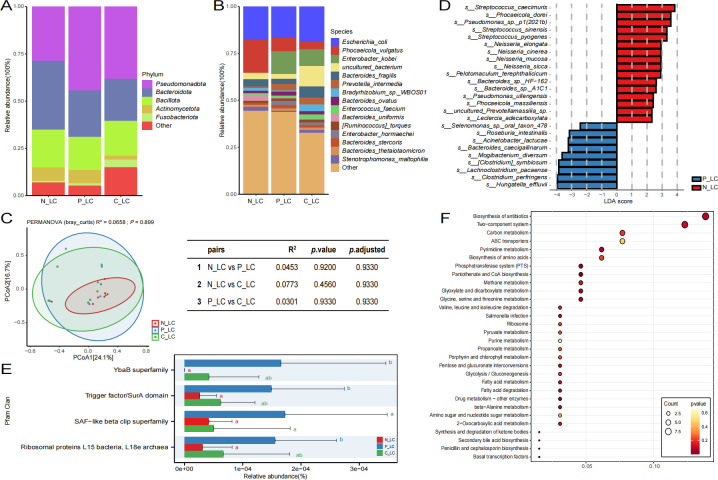
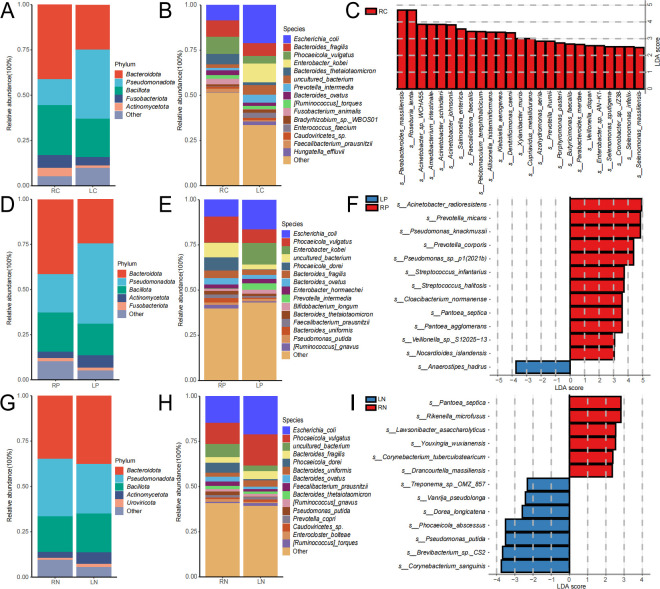
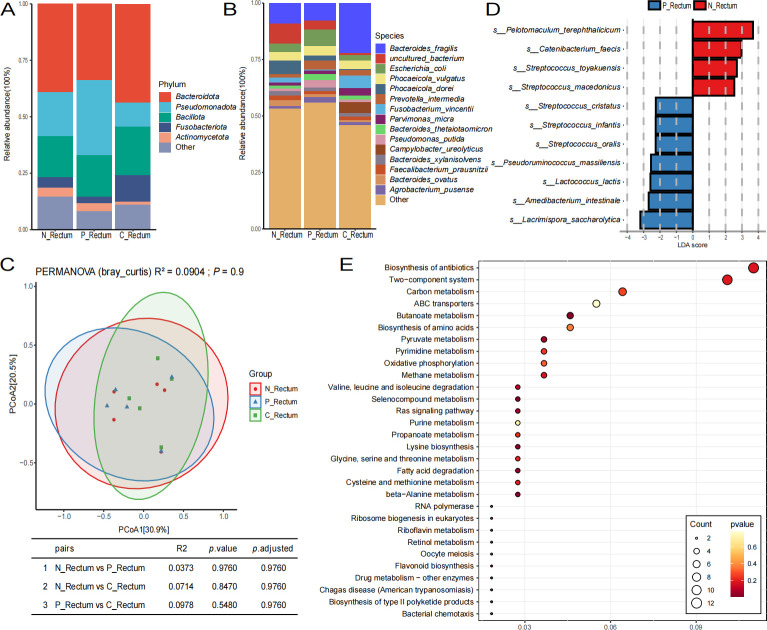
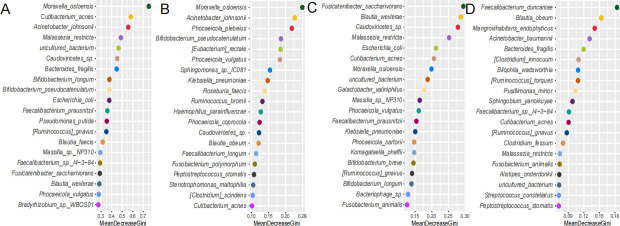
The gut microbiota is intricately associated with the onset and progression of colorectal cancer (CRC), leading to significant interest in developing prevention and treatment strategies that leverage gut microbiota. In this study, we collected 57 samples from 19 CRC patients, comprising cancerous tissue, paracancerous tissue, and normal mucosa. Utilizing metagenomic sequencing and bioinformatics analysis, we identified differences in the microbiomes and their functional characteristics across the various tissue types. The results indicated that species such as Alistipes putredinis were predominantly found in normal tissues, while Pseudomonas putida was enriched in paracancerous tissue, and Malassezia restricta was prevalent in cancerous tissues. Furthermore, the microbial functions exhibited variability among the different tissue types. Random forest analysis suggested that Moraxella osloensis may be implicated in the onset and progression of colorectal cancer. We also classified the patients into three subgroups based on the anatomical location of the colorectum: right-sided colon, left-sided colon, and rectum. The subgroup analysis revealed that the microbiota enriched in normal mucosa and paracancerous tissue varied across different anatomical sites. These findings not only elucidate the characteristics of the microbiomes in the normal mucosa, paracancerous tissue, and cancerous tissues of CRC patients, thereby providing new potential targets for clinical diagnosis and treatment, but also contribute to the existing microbiome data pertinent to CRC research.IMPORTANCEThis study provides crucial insights into the relationship between gut microbiota and colorectal cancer (CRC) by analyzing microbial communities in different tissue types and anatomical locations of CRC patients. We identified distinct microbial signatures, such as Alistipes putredinis in normal tissues and Malassezia restricta in cancerous tissues, indicating location-specific microbiomes with unique functional attributes. These findings suggest potential new biomarkers or therapeutic targets for CRC. The observed microbiota variations among right-sided colon, left-sided colon, and rectum cancers underscore the heterogeneity of CRC, pointing toward more personalized treatment strategies. By enhancing our understanding of the microbiome's role in CRC, this research paves the way for innovative diagnostic tools and targeted therapies tailored to individual patient profiles. This work is essential for advancing clinical approaches to CRC management.

Keywords: colorectal cancer; functional analysis; gut microbiota; intratissue bacteria; microbiome; right-sided colon.


Conflict of interest statement

The authors have declared no conflict of interest.

Figures

Fig 1
Fig 1
The microbiome analysis results of various types of colorectal tissues are presented as follows. Panels A and B illustrate the species composition at the phylum and species levels using bar graphs. Panel C displays the results of the Bray-Curtis β-diversity analysis, where the shapes of the data points indicate different groups. Panel D features the results of the LEfSe analysis, with the horizontal axis representing the LDA score and the vertical axis denoting the types of microbial species. Panel E shows a bar graph of the Pfam functional difference analysis, in which the horizontal axis represents relative abundance and the vertical axis represents different functional categories; letters that differ between the two groups indicate significant differences, while the absence of differing letters signifies no significant difference. Panel F presents a bubble chart depicting differential KEGG functions, where the horizontal axis denotes the Rich factor—with larger values indicating a greater proportion of genes enriched in the pathway relative to the total number of genes in that pathway—while the vertical axis indicates different functions. The size of the circles corresponds to the count of genes enriched in each function, and the color of the circles represents the P-value.
Fig 2
Fig 2
The microbiome analysis results from various types of tissues in the right-sided colon are presented as follows. Panels A and B display species composition bar charts at both the phylum and species levels. Panel C illustrates the results of the Bray-Curtis beta diversity analysis, where the shapes of different points correspond to distinct groups. Panel D presents the results of the LEfSe differential analysis, with the horizontal axis depicting the LDA score and the vertical axis indicating the type of microbial species. Panel E features a bar chart of Pfam functional differences, where the horizontal axis represents relative abundance, and the vertical axis indicates various functions; different letters between the two groups denote statistically significant differences, while the absence of differing letters indicates non-significance. As demonstrated in Panel F, the differential KEGG function bubble chart is presented. The horizontal axis denotes GeneRatio, with larger values indicating a greater total number of genes enriched in the pathway. The vertical axis represents different functions. The size of the circle corresponds to the number of counts enriched in the function, while the color of the circle signifies the P_value.
Fig 3
Fig 3
The microbiome analysis reveals the results from various tissue types in the left-sided colon. Panels A and B present bar graphs illustrating the composition of microbial communities at both the phylum and species levels. Panel C displays the Bray-Curtis β diversity analysis, with different shapes denoting distinct groups. Panel D showcases the results of LEfSe analysis, where the horizontal axis represents the LDA score and the vertical axis indicates different microbial species types. Panel E features a bar chart of Pfam functional differences, with the horizontal axis indicating relative abundance and the vertical axis representing various functions; significant differences between the two groups are denoted by different letters, while the absence of differing letters indicates no significant differences. As illustrated in panel F, the differential KEGG function bubble chart is displayed. The horizontal axis denotes GeneRatio, with larger values indicating a greater total number of genes enriched in the pathway. The vertical axis represents different functions. The size of the circle corresponds to the number of counts enriched in the function, while the color of the circle signifies the P_value.
Fig 4
Fig 4
The analysis results of the microbiome from various tissue types in the left and right colon are presented. Panels A, B, D, E, G, and H display bar charts illustrating the taxonomic composition at both the phylum and species levels, while panels C, F, and I show the results of LEfSe differential analysis, with the horizontal axis indicating LDA scores and the vertical axis representing the different types of microbial species.
Fig 5
Fig 5
The microbiome analysis results for various types of rectal tissues are presented as follows: Panels A and B display bar charts illustrating species composition at the phylum and species levels. Panel C shows the results of Bray-Curtis β-diversity analysis, with the shapes of different points representing distinct groups. Panel D presents the Lefse difference analysis, where the horizontal axis indicates the LDA score and the vertical axis denotes the type of microbial species. As illustrated in panel E, the differential KEGG function bubble chart is presented. The horizontal axis denotes GeneRatio, with larger values indicating a greater total number of genes enriched in the pathway. The vertical axis represents different functions. The size of the circle corresponds to the number of counts enriched in the function, while the color of the circle signifies the P_value.
Fig 6
Fig 6
The results of the random forest predictions for key microorganisms associated with colorectal cancer are presented in this study. Panel A displays the random forest prediction results for the overall colorectal grouping, while panel B focuses on the right-sided colon grouping, panel C focuses on the left-sided colon grouping, and panel D focuses on the rectal grouping. The horizontal axis represents the mean decrease Gini value, where a higher value indicates greater importance, and the vertical axis includes various species analyzed in the predictions.

Similar articles

References

    1. Bray F, Laversanne M, Sung H, Ferlay J, Siegel RL, Soerjomataram I, Jemal A. 2024. Global cancer statistics 2022: GLOBOCAN estimates of incidence and mortality worldwide for 36 cancers in 185 countries. CA A Cancer J Clinicians 74:229–263. doi: 10.3322/caac.21834 - DOI - PubMed
    1. Li N, Lu B, Luo C, Cai J, Lu M, Zhang Y, Chen H, Dai M. 2021. Incidence, mortality, survival, risk factor and screening of colorectal cancer: a comparison among China, Europe, and northern America. Cancer Lett 522:255–268. doi: 10.1016/j.canlet.2021.09.034 - DOI - PubMed
    1. Borges-Canha M, Portela-Cidade JP, Dinis-Ribeiro M, Leite-Moreira AF, Pimentel-Nunes P. 2015. Role of colonic microbiota in colorectal carcinogenesis: a systematic review. Rev Esp Enferm Dig 107:659–671. doi: 10.17235/reed.2015.3830/2015 - DOI - PubMed
    1. Aarnoutse R, de Vos-Geelen J, Penders J, Boerma EG, Warmerdam F, Goorts B, Olde Damink SWM, Soons Z, Rensen SSM, Smidt ML. 2017. Study protocol on the role of intestinal microbiota in colorectal cancer treatment: a pathway to personalized medicine 2.0. Int J Colorectal Dis 32:1077–1084. doi: 10.1007/s00384-017-2819-3 - DOI - PMC - PubMed
    1. Chen W, Liu F, Ling Z, Tong X, Xiang C. 2012. Human intestinal lumen and mucosa-associated microbiota in patients with colorectal cancer. PLoS One 7:e39743. doi: 10.1371/journal.pone.0039743 - DOI - PMC - PubMed

LinkOut - more resources