

Epidemic Dynamics and Intervention Measures in Campus Settings Based on Multilayer Temporal Networks
- PMID: 40422497
- PMCID: PMC12110693
- DOI: 10.3390/e27050543
Epidemic Dynamics and Intervention Measures in Campus Settings Based on Multilayer Temporal Networks
Abstract
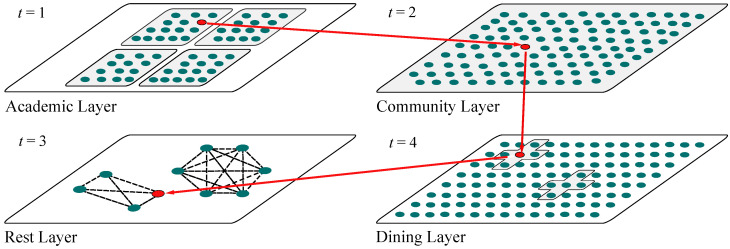
This study simulates the spread of epidemics on university campuses using a multilayer temporal network model combined with the SEIR (Susceptible-Exposed-Infectious-Recovered) transmission model. The proposed approach explicitly captures the time-varying contact patterns across four distinct layers (Rest, Dining, Activity, and Academic) to reflect realistic student mobility driven by class schedules and spatial constraints. It evaluates the impact of various intervention measures on epidemic spreading, including subnetwork closure and zoned management. Our analysis reveals that the Academic and Activity layers emerge as high-risk transmission hubs due to their dynamic, high-density contact structures. Intervention measures exhibit layer-dependent efficacy: zoned management is highly effective in high-contact subnetworks, its impact on low-contact subnetworks remains limited. Consequently, intervention measures must be dynamically adjusted based on the characteristics of each subnetwork and the epidemic situations, with higher participation rates enhancing the effectiveness of these measures. This work advances methodological innovation in temporal network epidemiology by bridging structural dynamics with SEIR processes, offering actionable insights for campus-level pandemic preparedness. The findings underscore the necessity of layer-aware policies to optimize resource allocation in complex, time-dependent contact systems.
Keywords: campus epidemics; intervention strategies; multilayer temporal network.
Conflict of interest statement
The authors declare that they have no known competing financial interests or personal relationships that could have appeared to influence the work reported in this paper.
Figures


Similar articles
-
Spatial heterogeneity and infection patterns on epidemic transmission disclosed by a combined contact-dependent dynamics and compartmental model.PLoS One. 2023 Jun 13;18(6):e0286558. doi: 10.1371/journal.pone.0286558. eCollection 2023. PLoS One. 2023. PMID: 37310972 Free PMC article.
-
Epidemic spreading on multilayer homogeneous evolving networks.Chaos. 2019 Oct;29(10):103146. doi: 10.1063/1.5108951. Chaos. 2019. PMID: 31675801
-
Modeling COVID-19 spread using multi-agent simulation with small-world network approach.BMC Public Health. 2024 Mar 2;24(1):672. doi: 10.1186/s12889-024-18157-x. BMC Public Health. 2024. PMID: 38431581 Free PMC article.
-
Compartmental structures used in modeling COVID-19: a scoping review.Infect Dis Poverty. 2022 Jun 21;11(1):72. doi: 10.1186/s40249-022-01001-y. Infect Dis Poverty. 2022. PMID: 35729655 Free PMC article.
-
Impact of summer programmes on the outcomes of disadvantaged or 'at risk' young people: A systematic review.Campbell Syst Rev. 2024 Jun 13;20(2):e1406. doi: 10.1002/cl2.1406. eCollection 2024 Jun. Campbell Syst Rev. 2024. PMID: 38873396 Free PMC article. Review.
References
-
- Anderson R.M. Infectious Diseases of Humans: Dynamics and Control. Oxford University Press; Oxford, UK: 1991. pp. 1–15.
-
- Zhao B., Wang X., Zhang T., Wang H. Estimating and modeling spontaneous mobility changes during the COVID-19 pandemic without stay-at-home orders. Humanit. Soc. Sci. Commun. 2024;11:1–15. doi: 10.1057/s41599-024-03068-4. - DOI
-
- Ingelbeen B., van Kleef E., Mbala P., Danis K., Macicame I., Hens N., Cleynen E., van der Sande M.A. Embedding risk monitoring in infectious disease surveillance for timely and effective outbreak prevention and control. BMJ Glob. Health. 2025;10:e016870. doi: 10.1136/bmjgh-2024-016870. - DOI - PMC - PubMed
Grants and funding
LinkOut - more resources
Full Text Sources
