

The Spatial Proximity of CD8+ FoxP3+PD-1+ Cells to Tumor Cells: A More Accurate Predictor of Immunotherapy Outcomes in Advanced Non-Small-Cell Lung Cancer
- PMID: 40422521
- PMCID: PMC12110189
- DOI: 10.3390/curroncol32050262
The Spatial Proximity of CD8+ FoxP3+PD-1+ Cells to Tumor Cells: A More Accurate Predictor of Immunotherapy Outcomes in Advanced Non-Small-Cell Lung Cancer
Abstract
Background: To optimize precision immunotherapy for advanced NSCLC, comprehensive tumor immune microenvironment (TIME) characterization is crucial for efficacy prediction.
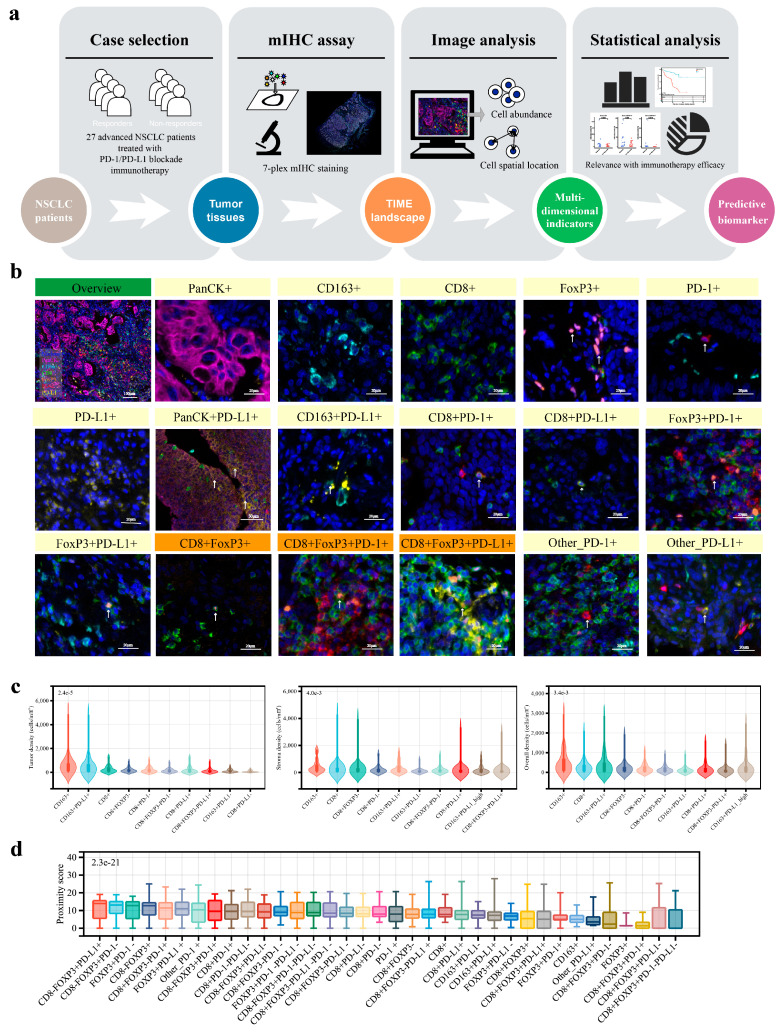
Methods: Pretreatment tumor samples from 46 advanced NSCLC patients treated with PD-1/PD-L1 inhibitors were analyzed. The subregional abundance and spatial proximity scores of TIME cell subpopulations in 27 samples were assessed via multiplex immunohistochemistry (mIHC) targeting pan-CK, CD163, CD8, FoxP3, PD-1, and PD-L1. Correlations between the TIME features, clinicopathologic factors, treatment response, and prognosis were evaluated.
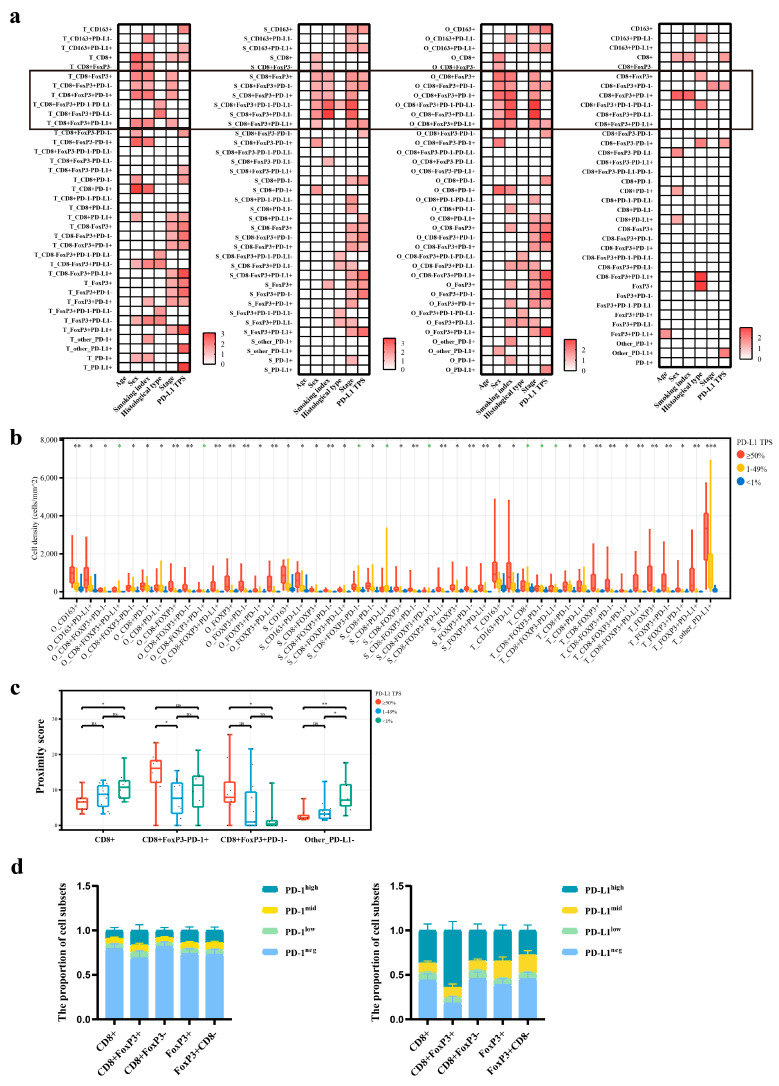
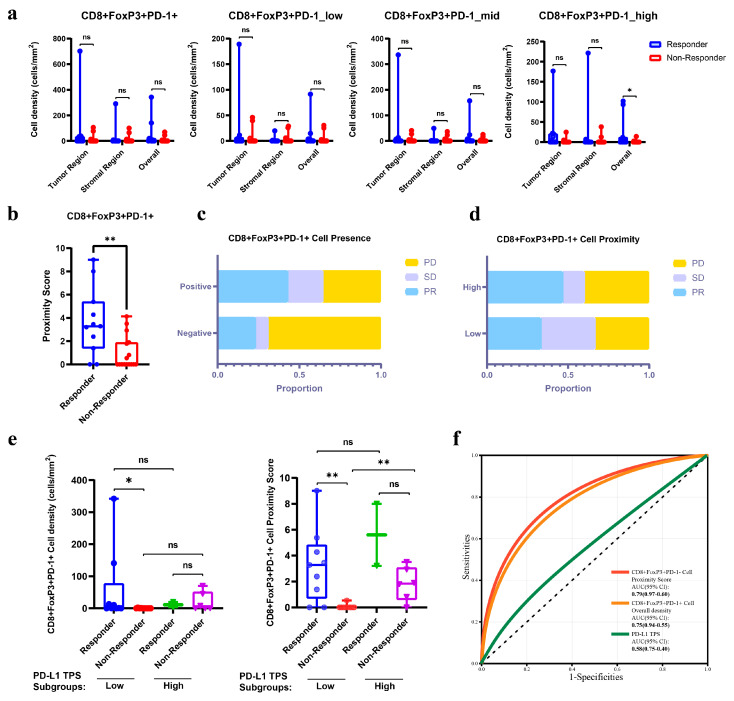
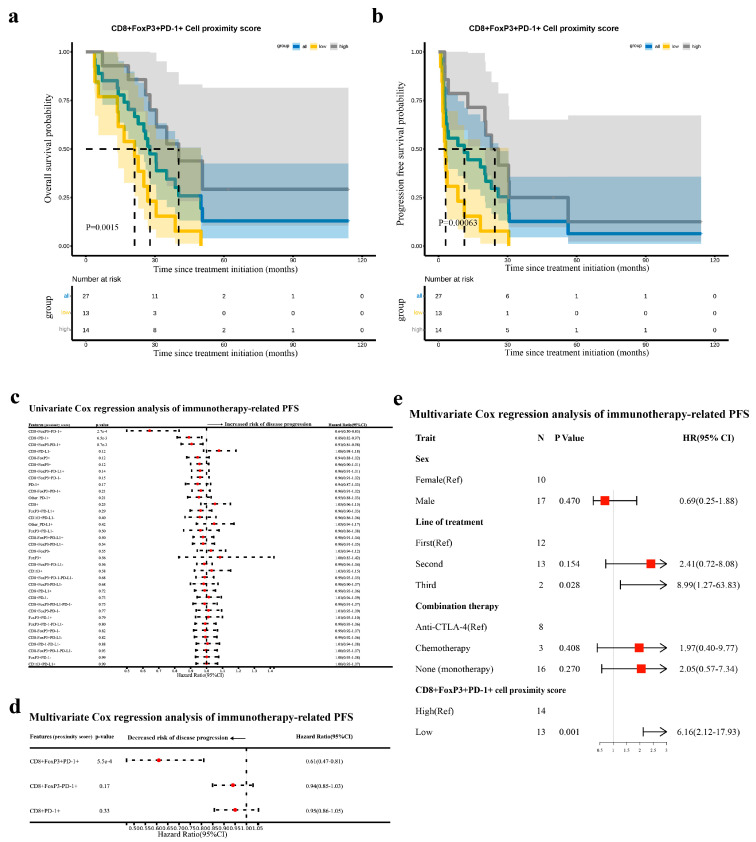
Results: CD8+FoxP3+ cells were identified in NSCLC tissues, predominantly expressing PD-1/PD-L1. The PD-L1 TPS subgroups showed significant immune cell density/proximity differences, but CD8+FoxP3+PD-1+ infiltration was PD-L1 TPS-independent. Responders had higher CD8+FoxP3+PD-1high density (p = 0.0497) and proximity scores (p = 0.0099) than non-responders. The CD8+FoxP3+PD-1+ presence and tumor proximity were essential for favorable outcomes. In low-PD-L1 TPS patients, the CD8+FoxP3+PD-1+ abundance and proximity scores strongly predicted the response (AUC: 0.79 and 0.75 vs. PD-L1 TPS AUC = 0.58). A survival analysis linked the presence and proximity score of CD8+FoxP3+PD-1+ cells to prolonged overall survival (OS) and progression-free survival (PFS). Notably, a low proximity score of CD8+FoxP3+PD-1+ cells emerged as an independent risk factor for a shorter PFS (HR = 6.16, 95% CI: 2.12-17.93, p = 0.001).
Conclusion: The CD8+FoxP3+PD-1+ spatial proximity to tumor cells robustly predicts improved immunotherapy outcomes in advanced NSCLC.
Keywords: CD8+FoxP3+PD-1+ cells; PD-1/PD-L1 blockade; advanced non-small-cell lung cancer; spatial proximity; therapeutic outcomes.
Conflict of interest statement
The authors have no relevant financial or non-financial interests to disclose.
Figures
Similar articles
-
Chemoradiotherapy efficacy is predicted by intra-tumour CD8+/FoxP3+ double positive T cell density in locally advanced N2 non-small-cell lung carcinoma.Eur J Cancer. 2020 Aug;135:221-229. doi: 10.1016/j.ejca.2020.04.040. Epub 2020 Jun 28. Eur J Cancer. 2020. PMID: 32610210
-
Immune Microenvironment Differences Between Squamous and Non-squamous Non-small-cell Lung Cancer and Their Influence on the Prognosis.Clin Lung Cancer. 2019 Jan;20(1):48-58. doi: 10.1016/j.cllc.2018.09.012. Epub 2018 Sep 24. Clin Lung Cancer. 2019. PMID: 30341017
-
PD-L1 expression and T cells infiltration in patients with uncommon EGFR-mutant non-small cell lung cancer and the response to immunotherapy.Lung Cancer. 2020 Apr;142:98-105. doi: 10.1016/j.lungcan.2020.02.010. Epub 2020 Feb 19. Lung Cancer. 2020. PMID: 32120230
-
Safety and Efficacy of PD-1/PD-L1 inhibitors combined with radiotherapy in patients with non-small-cell lung cancer: a systematic review and meta-analysis.Cancer Med. 2021 Feb;10(4):1222-1239. doi: 10.1002/cam4.3718. Epub 2021 Jan 19. Cancer Med. 2021. PMID: 33465302 Free PMC article.
-
Immunotherapy in NSCLC patients with brain metastases. Understanding brain tumor microenvironment and dissecting outcomes from immune checkpoint blockade in the clinic.Cancer Treat Rev. 2020 Sep;89:102067. doi: 10.1016/j.ctrv.2020.102067. Epub 2020 Jul 7. Cancer Treat Rev. 2020. PMID: 32682248 Review.
References
MeSH terms
Substances
Grants and funding
LinkOut - more resources
Full Text Sources
Medical
Research Materials
