

Apolipoprotein B and Glycemic Dysregulation: New Predictors of Type 2 Diabetes in High-Cardiovascular-Risk Populations
- PMID: 40423035
- PMCID: PMC12113198
- DOI: 10.3390/jpm15050163
Apolipoprotein B and Glycemic Dysregulation: New Predictors of Type 2 Diabetes in High-Cardiovascular-Risk Populations
Abstract
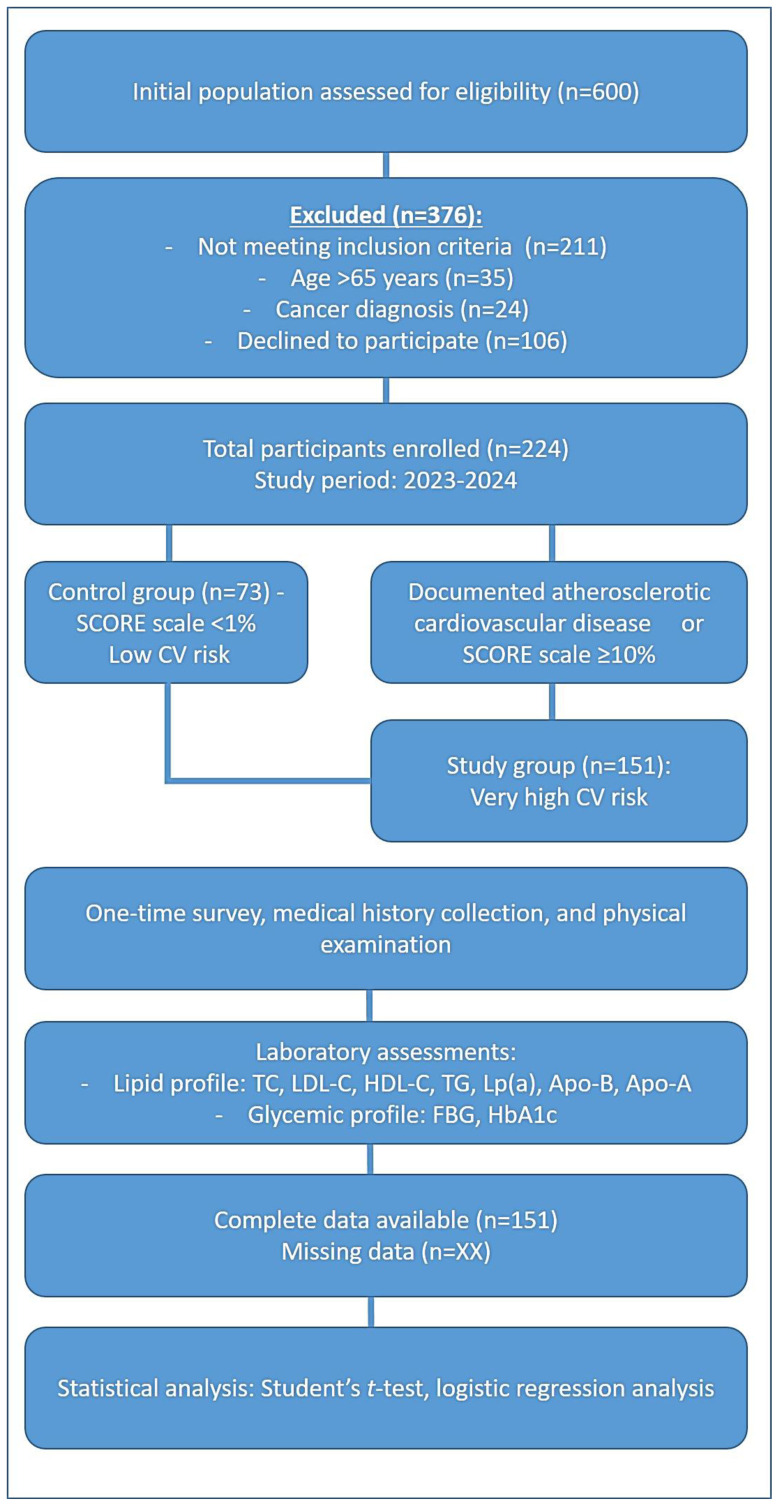
Background: Apolipoprotein B (ApoB), a key component of atherogenic lipoproteins, has been increasingly implicated in cardiometabolic disorders beyond dyslipidemia. However, its role in glycemic dysregulation remains unclear. This study aimed to investigate the association between ApoB levels and glycemic parameters, including fasting glucose, insulin resistance, and glycated hemoglobin (HbA1c), in individuals without diagnosed diabetes. Methods: This study was conducted at the National Research Cardiac Surgery Center (Kazakhstan) over the period between 2023 and 2024 as a cross-sectional analysis. Adults aged ≥ 20 years without diagnosed diabetes and with complete data on their ApoB and glycemic markers were included. Associations between ApoB and fasting plasma glucose (FPG), HbA1c, and HOMA-IR were assessed using multivariable linear and logistic regression models adjusted for demographic, lifestyle, and metabolic covariates. Results: Higher ApoB levels were significantly associated with increased fasting glucose (β = 2.07 mg/dL per 1-SD increase in ApoB, p < 0.001), higher HbA1c (β = 0.06%, p < 0.001), and elevated HOMA-IR (β = 0.54, p < 0.001). Participants in the highest ApoB quartile had 53% higher odds of prediabetes (adjusted OR = 1.53; 95% CI: 1.22-1.91; p < 0.001) compared to the lowest quartile. These associations remained significant after adjusting for BMI, lipid levels, and other confounders. Conclusions: Elevated ApoB is independently associated with adverse glycemic profiles in nondiabetic individuals, suggesting its potential role in early glucose metabolism disturbances.
Keywords: apolipoprotein B; cardiovascular risk; glycemic profile; lipid profile; lipoprotein(a); type 2 diabetes mellitus.
Conflict of interest statement
The authors declare that they have no competing interests.
Figures
Similar articles
-
Atherogenic lipid parameters in people with normal glucose tolerance: implications from elevated 1-hour post-load plasma glucose.Cardiovasc Diabetol. 2025 May 14;24(1):207. doi: 10.1186/s12933-025-02722-8. Cardiovasc Diabetol. 2025. PMID: 40369580 Free PMC article.
-
Association of Lipoprotein and Apolipoprotein Ratios With Glycemic Levels in Individuals With Prediabetes: A Case-Control Study.Cureus. 2024 Jun 30;16(6):e63500. doi: 10.7759/cureus.63500. eCollection 2024 Jun. Cureus. 2024. PMID: 39081429 Free PMC article.
-
Apolipoprotein A-I and B levels, dyslipidemia and metabolic syndrome in south-west Chinese women with PCOS.Hum Reprod. 2012 Aug;27(8):2484-93. doi: 10.1093/humrep/des191. Epub 2012 Jun 6. Hum Reprod. 2012. PMID: 22674204
-
Size and shape of the associations of glucose, HbA1c, insulin and HOMA-IR with incident type 2 diabetes: the Hoorn Study.Diabetologia. 2018 Jan;61(1):93-100. doi: 10.1007/s00125-017-4452-7. Epub 2017 Oct 10. Diabetologia. 2018. PMID: 29018885 Free PMC article.
-
Effect of Carnosine or β-Alanine Supplementation on Markers of Glycemic Control and Insulin Resistance in Humans and Animals: A Systematic Review and Meta-analysis.Adv Nutr. 2021 Dec 1;12(6):2216-2231. doi: 10.1093/advances/nmab087. Adv Nutr. 2021. PMID: 34333586 Free PMC article.
References
-
- Lee M.G.Y., Naimo P.S., Koshy A.N., Buratto E., Wilson W.M., Grigg L.E., Joshi S.B., English K.M. Coarctation of the aorta and accelerated atherosclerosis: A contemporary review on the burden of atherosclerotic cardiovascular disease. Int. J. Cardiol. Congen. 2025;19:100561. doi: 10.1016/j.ijcchd.2024.100561. - DOI - PMC - PubMed
Grants and funding
LinkOut - more resources
Full Text Sources
Miscellaneous
