

Time-Intensity Curve Analysis of Contrast-Enhanced Ultrasound for Non-Ossified Thyroid Cartilage Invasion in Laryngeal Squamous Cell Carcinoma
- PMID: 40423259
- PMCID: PMC12115638
- DOI: 10.3390/tomography11050057
Time-Intensity Curve Analysis of Contrast-Enhanced Ultrasound for Non-Ossified Thyroid Cartilage Invasion in Laryngeal Squamous Cell Carcinoma
Abstract
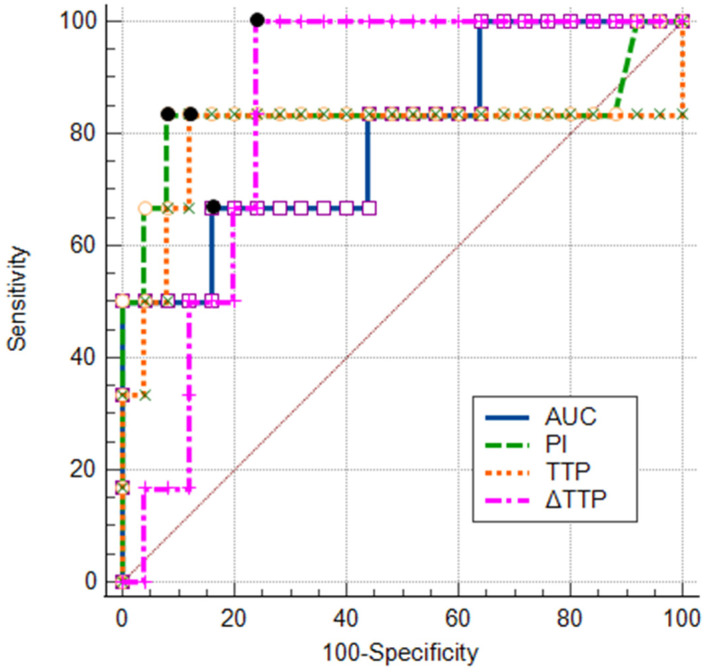
Objective: This study aimed to assess the diagnostic value of contrast-enhanced ultrasound (CEUS) time-intensity curve (TIC) parameters in detecting non-ossified thyroid cartilage invasion in patients with laryngeal squamous cell carcinoma (SCC). Methods: A CEUS TIC analysis was performed on 32 cases from 27 patients with histologically confirmed laryngeal SCC. The diagnostic performance of time to peak (TTP), peak intensity (PI), wash-in slope (WIS), area under the curve (AUC), and their quantitative differences (∆TTP, ∆PI, ∆WIS, and ∆AUC) to discriminate between the invaded and the non-invaded non-ossified thyroid cartilage was determined using ROC analysis. A logistic regression analysis was employed to identify significant predictors. Results: In an ROC analysis, of all TIC parameters analyzed separately, ∆TTP showed the greatest diagnostic performance (AUC: 0.85). A ∆TTP cut-off of ≤ 8.9 s differentiated between the invaded and the non-invaded non-ossified thyroid cartilage with a sensitivity of 100%, specificity of 76.9%, and accuracy of 81.3%. A combination of ∆TTP and PI increased the AUC to 0.93, specificity to 100%, and accuracy to 96.8%, but reduced the sensitivity to 83.3%. Meanwhile, the visual assessment of enhancement on CEUS to detect cartilage invasion had 83.3% sensitivity and 84.6% specificity. In a univariate logistic regression, only ∆TTP was a significant predictor of non-ossified thyroid cartilage invasion (OR: 0.80; 95% CI: 0.64-1.00). For every second increase in ∆TTP, the probability of thyroid cartilage invasion decreased by 20%. Conclusions: CEUS TIC parameters, particularly a combination of ∆TTP and PI, showed high diagnostic performance in the detection of non-ossified thyroid cartilage invasion in laryngeal SCC.
Keywords: contrast-enhanced ultrasound; diagnostic performance; laryngeal squamous cell carcinoma; non-ossified thyroid cartilage invasion.
Conflict of interest statement
The authors declare no conflicts of interest.
Figures
Similar articles
-
CT-scan prediction of thyroid cartilage invasion for early laryngeal squamous cell carcinoma.Eur Arch Otorhinolaryngol. 2013 Jan;270(1):287-91. doi: 10.1007/s00405-012-2005-8. Epub 2012 Mar 30. Eur Arch Otorhinolaryngol. 2013. PMID: 22460527
-
CT-based radiomics features in the prediction of thyroid cartilage invasion from laryngeal and hypopharyngeal squamous cell carcinoma.Cancer Imaging. 2020 Nov 11;20(1):81. doi: 10.1186/s40644-020-00359-2. Cancer Imaging. 2020. PMID: 33176885 Free PMC article.
-
The Diagnostic Value of CEUS in Assessing Non-Ossified Thyroid Cartilage Invasion in Patients with Laryngeal Squamous Cell Carcinoma.J Clin Med. 2024 Feb 3;13(3):891. doi: 10.3390/jcm13030891. J Clin Med. 2024. PMID: 38337585 Free PMC article.
-
Comparison of MR Imaging and Dual-Energy CT for the Evaluation of Cartilage Invasion by Laryngeal and Hypopharyngeal Squamous Cell Carcinoma.AJNR Am J Neuroradiol. 2018 Mar;39(3):524-531. doi: 10.3174/ajnr.A5530. Epub 2018 Jan 25. AJNR Am J Neuroradiol. 2018. PMID: 29371253 Free PMC article.
-
Is there a role for PET/CT parameters to differentiate thyroid cartilage invasion from penetration?Eur J Radiol. 2016 Feb;85(2):319-23. doi: 10.1016/j.ejrad.2015.11.039. Epub 2015 Dec 7. Eur J Radiol. 2016. PMID: 26781136 Free PMC article.
References
-
- Machiels J.P., René Leemans C., Golusinski W., Grau C., Licitra L., Gregoire V. Squamous cell carcinoma of the oral cavity, larynx, oropharynx and hypopharynx: EHNS–ESMO–ESTRO Clinical Practice Guidelines for diagnosis, treatment and follow-up. Ann. Oncol. 2020;31:1462–1475. doi: 10.1016/j.annonc.2020.07.011. - DOI - PubMed
-
- Choi Y.S., Park S.G., Song E.K., Cho S.H., Park M.R., Park K.U., Lee K.-H., Song I.-C., Lee H.J., Jo D.-Y., et al. Comparison of the therapeutic effects of total laryngectomy and a larynx-preservation approach in patients with T4a laryngeal cancer and thyroid cartilage invasion: A multicenter retrospective review. Head Neck. 2016;38:1271–1277. doi: 10.1002/hed.24438. - DOI - PubMed
MeSH terms
Substances
LinkOut - more resources
Full Text Sources
Research Materials
Miscellaneous
