

Multi-Mycotoxin Contamination in Serbian Maize During 2021-2023: Climatic Influences and Implications for Food and Feed Safety
- PMID: 40423310
- PMCID: PMC12116126
- DOI: 10.3390/toxins17050227
Multi-Mycotoxin Contamination in Serbian Maize During 2021-2023: Climatic Influences and Implications for Food and Feed Safety
Abstract
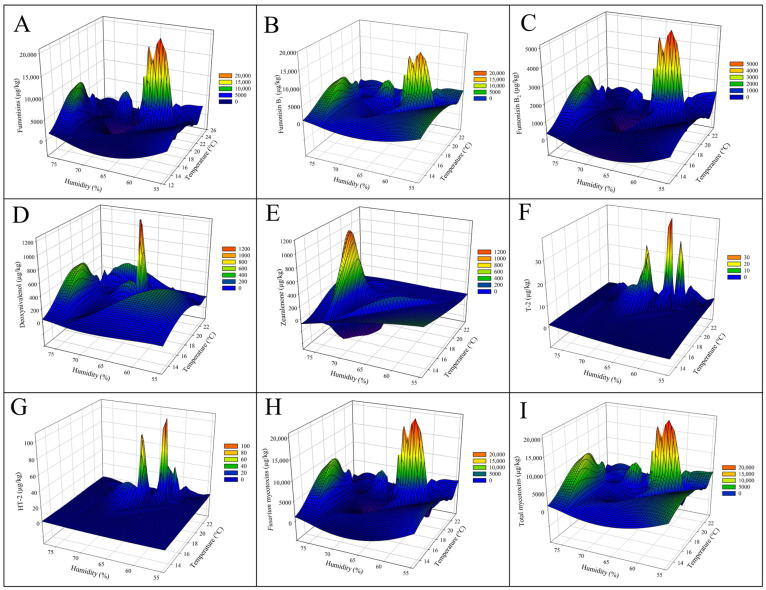
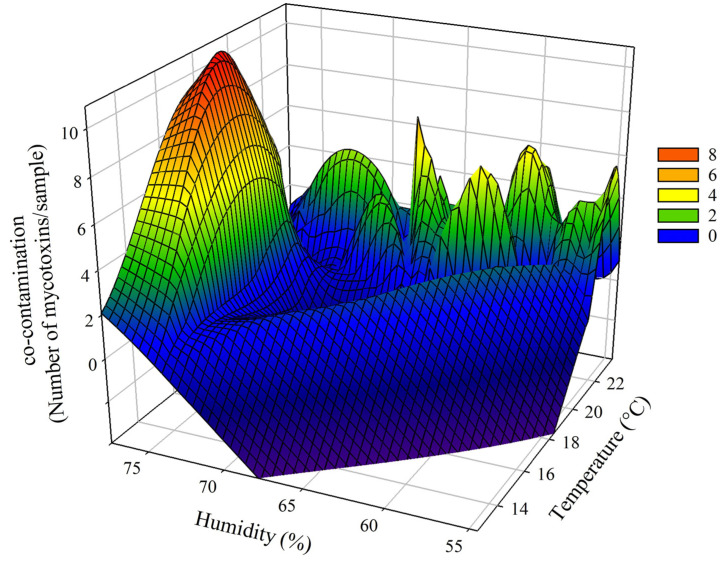
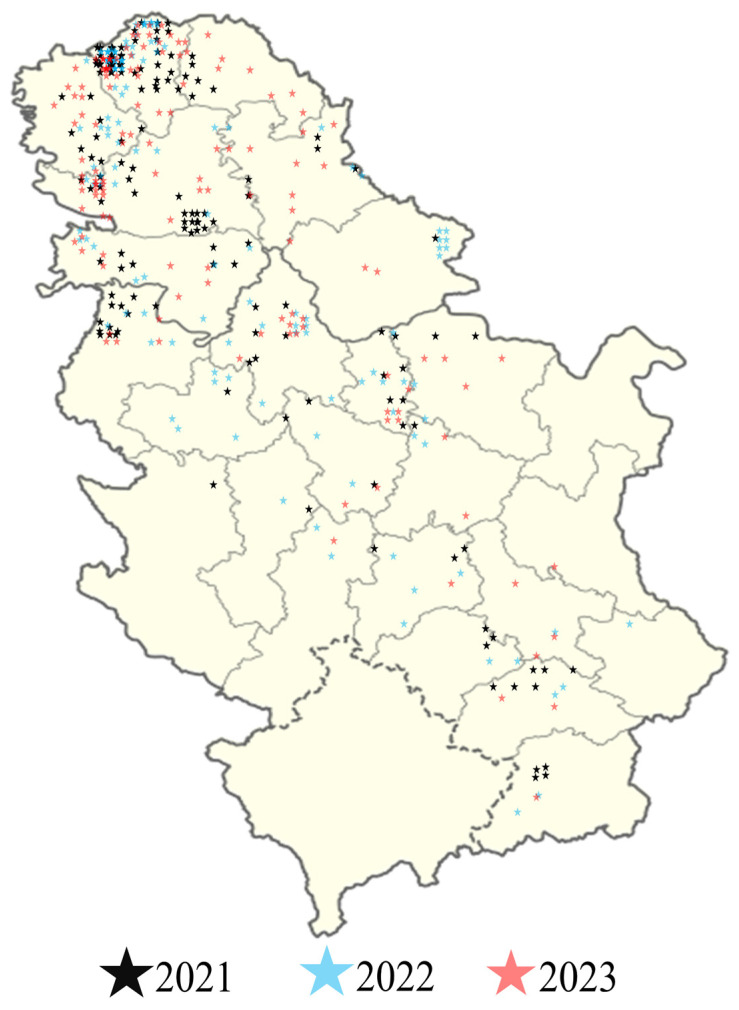
Mycotoxin contamination in maize poses significant food and feed safety risks, particularly in regions with variable climatic conditions like Serbia. This study investigated the occurrence of regulated mycotoxins in maize harvested across the Republic of Serbia from 2021 to 2023, emphasizing the impact of climatic factors. A total of 548 samples of unprocessed maize grains were analysed for the presence of key mycotoxins, including aflatoxins, ochratoxin A, zearalenone, deoxynivalenol, fumonisins, and trichothecenes type A (T-2 and HT-2 toxins), using validated analytical methods. The results revealed high contamination frequencies, with aflatoxins and fumonisins being the most prevalent. The results revealed substantial temporal variability and frequent co-contamination of mycotoxins. Aflatoxin B1 (AFB1) was the most concerning contaminant, with 73.2% of the samples in 2022 exceeding the European regulatory limit for human consumption (5 µg/kg) for un processed maize grains, reaching peak concentrations of 527 µg/kg, which is 105.4 times higher than the allowed limit. For animal feed, the limit of 20 µg/kg was exceeded in 40.5% of the samples, with the highest concentration being 26.4 times greater than the maximum allowable level. In 2021, the non-compliance rates for AFB1 in food and feed were 8.3% and 2.3%, respectively, while in 2023, they were 23.2% and 12.2%, respectively. Fumonisins contamination was also high, particularly in 2021, with fumonisin B1 (FB1) detected in 87.1% of samples and average concentrations reaching 4532 µg/kg. Although levels decreased in 2023 (70.7% occurrence, average 885 µg/kg), contamination remained significant. Deoxynivalenol (DON) contamination was consistently high (>70% of samples), with peak concentrations of 606 µg/kg recorded in 2021. Zearalenone (ZEN) and ochratoxin A (OTA) occurred less frequently, but ZEN levels peaked in 2022 at 357.6 µg/kg, which is above the regulatory limit of 350 µg/kg for food. Trichothecenes (HT-2 and T-2 toxins) were detected sporadically, with concentrations well below critical thresholds. Co-occurrence of mycotoxins was frequent, with significant mixtures detected, particularly between aflatoxins and fumonisins, as well as other fusarial toxins. The analysis demonstrated that temperature, humidity, and rainfall during both the growing and harvest seasons strongly influenced mycotoxin levels, with the most severe contamination occurring under specific climatic conditions. Notably, the highest mycotoxin levels, like aflatoxins, were linked to warmer temperatures and lower rainfall. The high non-compliance rates for aflatoxins and fumonisins and co-contamination pose significant food and feed safety risks. From a public health perspective, chronic exposure to contaminated maize increases the likelihood of carcinogenesis and reproductive disorders. Reduced productivity and bioaccumulation in animal tissues/products represent serious economic and safety concerns for livestock. This study provides insights into the potential risks to food and feed safety and the need for enhanced regulatory frameworks, continuous monitoring, and mitigation strategies in Serbia as well as other geographical regions.
Keywords: Serbia; aflatoxins; climate; co-contamination; food safety; fumonisins; maize; mycotoxins.
Conflict of interest statement
The authors declare that this study was conducted under international stand-ards of good scientific practices. F.P.-T. and G.G. are employees of Agromed Austria GmbH. J.R., H.F., Z.D., S.C., and M.V. are employees of PATENT CO. Mišićevo. These companies manufacture feed additives. However, the authors affirm that the employment affiliations did not influence the study’s design, sample collection, analyses, or data interpretation.
Figures
Similar articles
-
Mould incidence and mycotoxin contamination in freshly harvested maize kernels originated from India.J Sci Food Agric. 2014 Oct;94(13):2674-83. doi: 10.1002/jsfa.6608. Epub 2014 Mar 7. J Sci Food Agric. 2014. PMID: 24609945
-
Occurrence of Co-Contamination and Interaction of Multi-Mycotoxins in Dairy Cow Feed in China.Toxins (Basel). 2025 Mar 14;17(3):137. doi: 10.3390/toxins17030137. Toxins (Basel). 2025. PMID: 40137910 Free PMC article.
-
Occurrence of Fusarium mycotoxins in maize imported into the UK, 2004-2007.Food Addit Contam Part A Chem Anal Control Expo Risk Assess. 2009 Mar;26(3):363-71. doi: 10.1080/02652030802406219. Food Addit Contam Part A Chem Anal Control Expo Risk Assess. 2009. PMID: 19680910
-
Individual and combined occurrences of the prevalent mycotoxins in commercial feline and canine food.Mycotoxin Res. 2024 Nov;40(4):547-558. doi: 10.1007/s12550-024-00545-2. Epub 2024 Jul 11. Mycotoxin Res. 2024. PMID: 38990416 Review.
-
Current situation of mycotoxin contamination and co-occurrence in animal feed--focus on Europe.Toxins (Basel). 2012 Oct;4(10):788-809. doi: 10.3390/toxins4100788. Epub 2012 Oct 1. Toxins (Basel). 2012. PMID: 23162698 Free PMC article. Review.
References
-
- Erenstein O., Jaleta M., Sonder K., Mottaleb K., Prasanna B.M. Global maize production, consumption and trade: Trends and R&D implications. Food Secur. 2022;14:1295–1319.
-
- Grčak M., Grčak D., Penjišević A., Simjanović D., Orbović B., Đukić N., Rajičić V. The trends in maize and wheat production in the Republic of Serbia. Acta Agric. Serbica. 2020;25:121–127. doi: 10.5937/AASer2050121G. - DOI
-
- Kos J., Hajnal E.J., Malachová A., Steiner D., Stranska M., Krska R., Poschmaier B., Sulyok M. Mycotoxins in maize harvested in the Republic of Serbia in the period 2012–2015. Part 1: Regulated mycotoxins and its derivatives. Food Chem. 2020;312:126034. doi: 10.1016/j.foodchem.2019.126034. - DOI - PubMed
MeSH terms
Substances
LinkOut - more resources
Full Text Sources
Medical
