. 2025 Jun 5;32(6):e250101.
doi: 10.1530/ERC-25-0101. Print 2025 Jun 1.

Integrin-fibronectin interaction is a pivotal biological and clinical determinant in papillary thyroid carcinoma

Integrin-fibronectin interaction is a pivotal biological and clinical determinant in papillary thyroid carcinoma

Domenico Rocco et al. Endocr Relat Cancer. .

Abstract

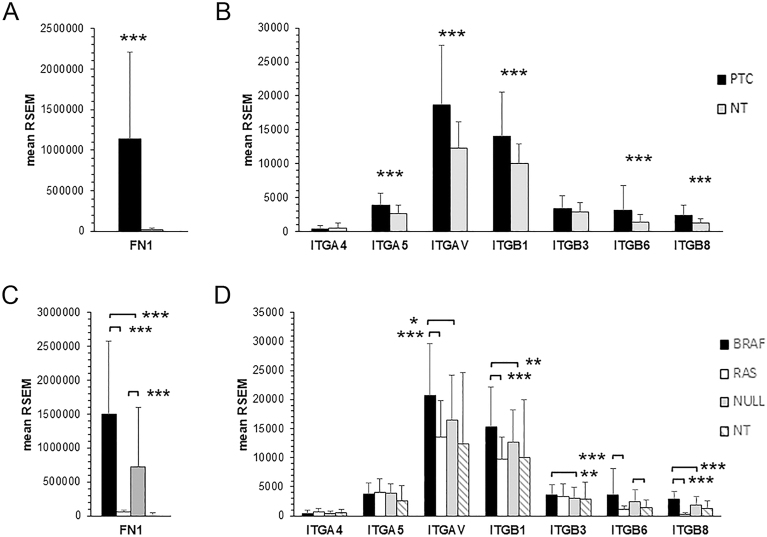
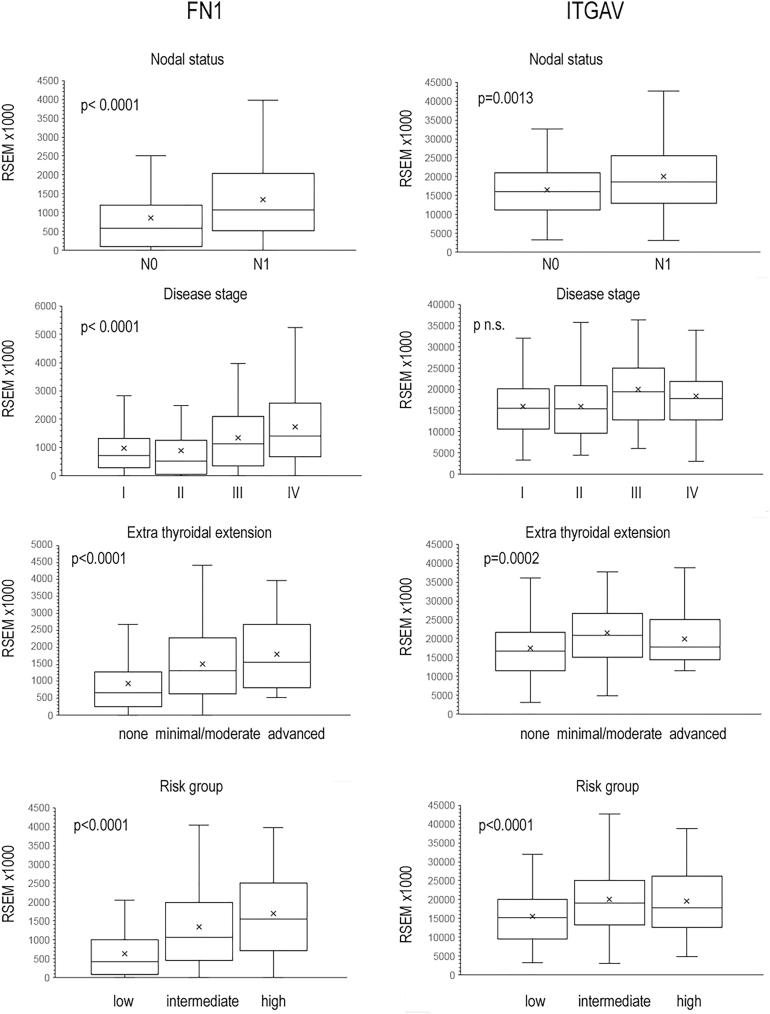
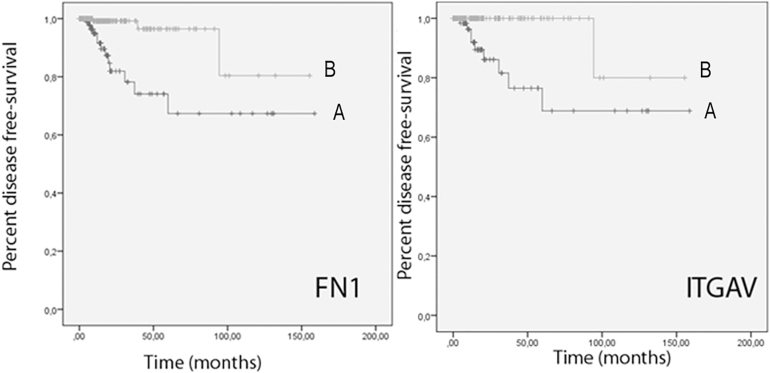
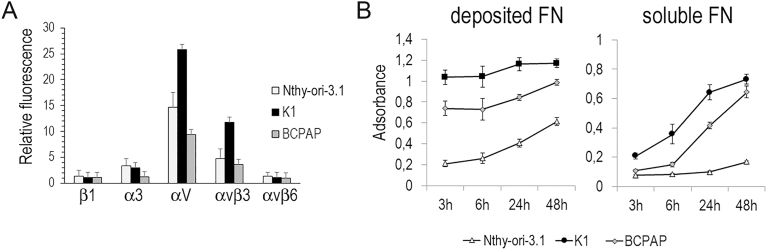
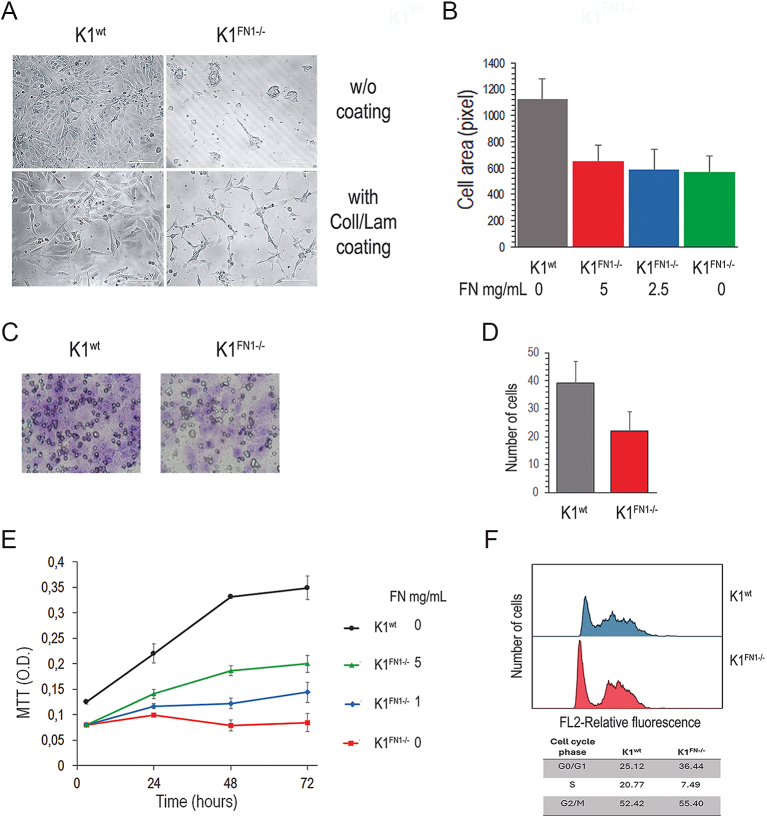
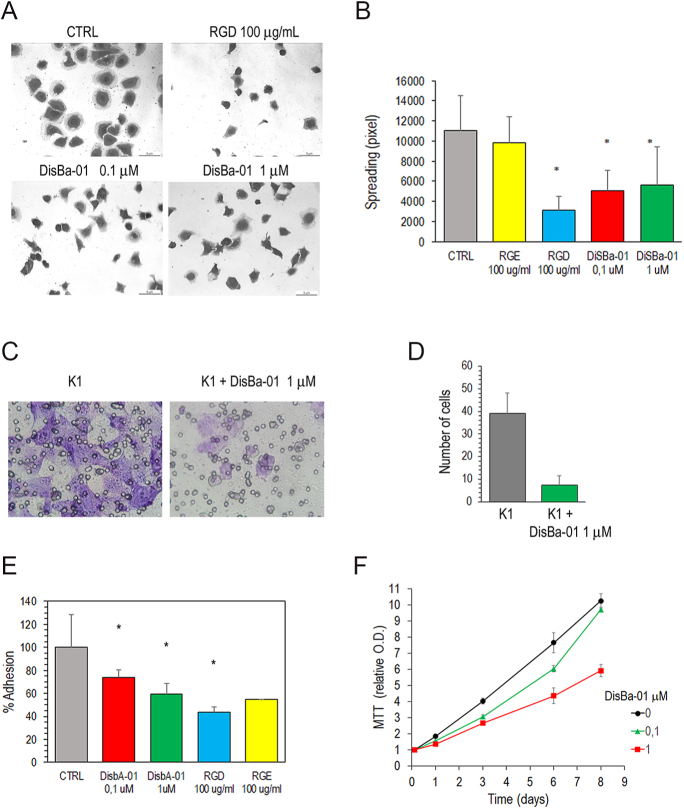
Integrins influence tumor growth, metastasis, and angiogenesis, making them potential targets for therapeutic intervention. In this study, we analyzed the TCGA mRNA-seq dataset to assess the expression levels of fibronectin (FN1) and associated integrin subunits, evaluating their relationship with clinical features in papillary thyroid cancer (PTC). These findings were further validated in a cell model. FN1 mRNA levels in BRAFV600E-positive PTC were 80-fold compared to normal thyroid tissue (NT), whereas PTC with RAS mutations exhibited FN1 levels similar to NT. ITGAV, encoding the αv integrin subunit, which pairs with β3 to form a receptor for FN, was also overexpressed in PTC. Elevated FN1 expression, and to a lesser extent ITGAV, correlated positively with lymph node metastasis, advanced cancer stages, extrathyroidal extension, and poorer prognoses. Patients in the highest quartile of FN1 expression had an increased risk of disease recurrence (OR = 7.277, 95% CI: 2.019-26.191, P < 0.0024). A non-tumoral thyroid cell line and two PTC cell lines were used as models to validate the mRNA-seq results. The proliferation and migration of a FN1 knock-out PTC cell mutant were significantly reduced and proliferation was restored upon the addition of soluble FN. DisBa-01, a recombinant RGD-disintegrin derived from Bothrops alternatus snake venom, which acts as an antagonist to the FN/αvβ3 interaction, inhibited PTC cell proliferation and migration. These results demonstrate that FN expression is a hallmark of aggressiveness in PTC. FN/αvβ3 interaction plays a pivotal role in PTC, suggesting that the FN/αvβ3 signaling is a potential therapeutic target for disintegrins or other molecules with similar action.

Keywords: disintegrins; fibronectin; integrins; thyroid cancer.


Conflict of interest statement

The authors declare that there is no conflict of interest that could be perceived as prejudicing the impartiality of the work reported.

Figures

Figure 1
Figure 1
mRNA expression of FN1 (A) and integrin subunits binding FN (B) in PTC (black bars) and NT (gray bars). Correlation between FN1 (C) or integrin (D) expression and driver mutations in PTC. The gene expression was determined in PTC cases with BRAFV600E (BRAF, n = 204), RAS mutation (RAS, n = 19), or neither mutation (NULL, n = 132). Only PTCcl and PTCtc were considered. Data are presented as the mean ± standard deviation. Wilcoxon test: *P < 0.01, **P < 0.001, ***P < 0.00001; RNA-seq by expectation maximization.
Figure 2
Figure 2
Correlation of FN1 and ITGAV mRNA expressions and clinical features of patients with PTC.
Figure 3
Figure 3
Kaplan–Meier analysis of disease-free survival of patients with FN1 and ITGAV mRNA expressions above (A) or below the median (B). FN1, P < 0.001; ITGAV, P = 0.002.
Figure 4
Figure 4
Integrin expression and FN production in Nthy-ori-3.1, BCPAP and K1 cells. (A) Integrin expression was determined by flow cytometry with specific antibodies. (B) Cells were cultured for the indicated time in 96-wells plates, the amount of immobilized FN (right) and soluble FN in the supernatant (left) were determined by ELISA. Relative FN content per well is expressed as the mean absorbance ± SD of triplicate wells.
Figure 5
Figure 5
Migration and proliferation of FN1 knock-out K1 cell mutants. (A) K1wt and K1FN1−/− cells cultured for 4 days in serum-free medium in uncoated plates (top) or plates coated with collagen and laminin (bottom). In uncoated plates, K1FN1−/− do not attach to the plate and form floating aggregates. In collagen/laminin coated plates, K1FN1−/− adhere to the plate and spread, although less than K1wt. (B) Spreading of cells cultured for 72 h in collagen/laminin coated plates in the presence of soluble FN added to the serum-free medium. Cell spreading is not affected by soluble FN. (C) Representative images of K1wt and K1FN1−/− cells on the lower surface of Transwell inserts, photographed at 200× magnification. The lower chambers were filled with medium supplemented with 5% FBS, depleted of fibronectin. (D) Quantification of migrated cells to the lower surface of the Transwell inserts. Data represents the mean ± SD from three independent experiments. Statistical significance was determined using the Student’s t-test (P < 0.0001). (E) Cell proliferation measured as MTT absorbance in collagen/laminin coated plates in the presence of soluble FN in the serum-free medium. (F) Cell cycle analysis by flow cytometry after 48 h serum-free culture in collagen/laminin coated plates. DNA synthesis is reduced in K1FN1−/− cells. *P < 0.0001.
Figure 6
Figure 6
Effect of DisBa-01 on K1 cells. DisBa-01, RGD or RGE were added to K1 cells plated in medium with 10% FBS. (A) Cells observed after 3 h. (B) Surface area of the cells measured by the ImageJ Version 1.54i and expressed as the mean ± SD pixel. (C) Cell adhesion after 3 h treatment. (D) Representative images of K1 cells without or with 1 μM DisBa-01 on the lower surface of Transwell inserts, photographed at 200× magnification. The lower chambers were filled with medium supplemented with 5% FBS, depleted of fibronectin. (E) Quantification of migrated cells to the lower surface of the Transwell inserts. Data represent the mean ± SD from three independent experiments. Statistical significance was determined using the Student’s t-test (P < 0.0001). (F) Cell proliferation determined by MTT assay. Data are presented as relative to the 3 h time point. *P < 0.0001.

Similar articles

References

    1. Barney LE, Hall CL, Schwartz AD, et al. 2020. Tumor cell-organized fibronectin maintenance of a dormant breast cancer population. Sci Adv 6 eaaz4157. ( 10.1126/sciadv.aaz4157) - DOI - PMC - PubMed
    1. Benjamini Y & Cohen R. 2017. Weighted false discovery rate controlling procedures for clinical trials. Biostatistics 18 91–104. ( 10.1093/biostatistics/kxw030) - DOI - PMC - PubMed
    1. Chastney MR, Kaivola J, Leppanen VM, et al. 2025. The role and regulation of integrins in cell migration and invasion. Nat Rev Mol Cell Biol 26 147–167. ( 10.1038/s41580-024-00777-1) - DOI - PubMed
    1. Chernaya G, Mikhno N, Khabalova T, et al. 2018. The expression profile of integrin receptors and osteopontin in thyroid malignancies varies depending on the tumor progression rate and presence of BRAF V600E mutation. Surg Oncol 27 702–708. ( 10.1016/j.suronc.2018.09.007) - DOI - PubMed
    1. Dahlman T, Grimelius L, Wallin G, et al. 1998. Integrins in thyroid tissue: upregulation of alpha2beta1 in anaplastic thyroid carcinoma. Eur J Endocrinol 138 104–112. ( 10.1530/eje.0.1380104) - DOI - PubMed