Validation of Four Prognostic Models for Metastatic Posterior Uveal Melanoma in a Danish Cohort
- PMID: 40423622
- PMCID: PMC12124156
- DOI: 10.1167/iovs.66.5.38
Validation of Four Prognostic Models for Metastatic Posterior Uveal Melanoma in a Danish Cohort
Abstract
Purpose: The purpose of this study was to validate the four prognostic models in patients with metastatic posterior uveal melanoma: (I) the American Joint Committee on Cancer (AJCC) staging system, (II) the Helsinki University Hospital Working Formulation (HUHWF), and two nomograms (III) the Valpione-nomogram, and (IV) the Mariani-nomogram.
Methods: One hundred fifty-two patients with metastatic posterior uveal melanoma were retrospectively included. Dictated by data availability, five subcohorts were established: AJCC (n = 152), HUHWF (n = 93), Valpione-nomogram (n = 92), Mariani-nomogram (n = 68), and a complete dataset subcohort (n = 64). The predictive performance was evaluated with time-dependent Brier-score, calibration plots, receiver operating characteristic (ROC) curves, and the global Harrell's C-index.
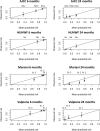
Results: The 6-month area under the ROC curve (AUC) was between 0.83 and 0.87 for, respectively, the Mariani-nomogram, the HUHWF, and the Valpione-nomogram, and was 0.77 for the AJCC staging system. The 24-month AUC was 0.81 for the Mariani-nomogram, compared with 0.79 (Valpione-nomogram), 0.74 (HUHWF), and 0.64 (AJCC). The C-index was 0.69 for the Mariani-nomogram, 0.71 for the Valpione-nomogram, and 0.73 for HUHWF (not calculated for AJCC). The accuracy of the prediction models, represented by the Brier score, was after 6 months and 24 months: 0.08 and 0.13 for the Mariani-nomogram, 0.10 and 0.17 for the Valpione-nomogram, 0.10 and 0.14 for the HUHWF, and 0.15 and 0.14 for the AJCC staging system.
Conclusions: All four models demonstrated an acceptable predictive performance at 6 and 24 months. The Mariani-nomogram appears to perform well across most metrics, often showing the highest values for AUC and the lowest Brier scores.
Conflict of interest statement
Disclosure:
Figures


Similar articles
-
Development and validation of a nomogram to predict cancer-specific survival of uveal melanoma.BMC Ophthalmol. 2021 May 25;21(1):230. doi: 10.1186/s12886-021-01968-6. BMC Ophthalmol. 2021. PMID: 34030647 Free PMC article.
-
The prognostic effect of American Joint Committee on Cancer staging and genetic status in patients with choroidal and ciliary body melanoma.Invest Ophthalmol Vis Sci. 2014 Dec 23;56(1):438-44. doi: 10.1167/iovs.14-15571. Invest Ophthalmol Vis Sci. 2014. PMID: 25537201
-
Development and validation of a nomogram for predicting cancer-specific survival in small-bowel adenocarcinoma patients using the SEER database.World J Surg Oncol. 2024 Jun 7;22(1):151. doi: 10.1186/s12957-024-03438-x. World J Surg Oncol. 2024. PMID: 38849854 Free PMC article.
-
Combining PSMA-PET and PROMISE to re-define disease stage and risk in patients with prostate cancer: a multicentre retrospective study.Lancet Oncol. 2024 Sep;25(9):1188-1201. doi: 10.1016/S1470-2045(24)00326-7. Epub 2024 Jul 29. Lancet Oncol. 2024. PMID: 39089299
-
A nomogram for predicting cancer-specific survival in patients with locally advanced unresectable esophageal cancer: development and validation study.Front Immunol. 2025 Feb 14;16:1524439. doi: 10.3389/fimmu.2025.1524439. eCollection 2025. Front Immunol. 2025. PMID: 40028339 Free PMC article.
References
Publication types
MeSH terms
LinkOut - more resources
Full Text Sources
Medical

