Review
. 2025 May 27;17(1):279.
doi: 10.1007/s40820-025-01786-1.

Sensors Innovations for Smart Lithium-Based Batteries: Advancements, Opportunities, and Potential Challenges

Affiliations
Review

Sensors Innovations for Smart Lithium-Based Batteries: Advancements, Opportunities, and Potential Challenges

Jamile Mohammadi Moradian et al. Nanomicro Lett. .

Abstract

Lithium-based batteries (LiBs) are integral components in operating electric vehicles to renewable energy systems and portable electronic devices, thanks to their unparalleled energy density, minimal self-discharge rates, and favorable cycle life. However, the inherent safety risks and performance degradation of LiB over time impose continuous monitoring facilitated by sophisticated battery management systems (BMS). This review comprehensively analyzes the current state of sensor technologies for smart LiBs, focusing on their advancements, opportunities, and potential challenges. Sensors are classified into two primary groups based on their application: safety monitoring and performance optimization. Safety monitoring sensors, including temperature, pressure, strain, gas, acoustic, and magnetic sensors, focus on detecting conditions that could lead to hazardous situations. Performance optimization sensors, such as optical-based and electrochemical-based, monitor factors such as state of charge and state of health, emphasizing operational efficiency and lifespan. The review also highlights the importance of integrating these sensors with advanced algorithms and control approaches to optimize charging and discharge cycles. Potential advancements driven by nanotechnology, wireless sensor networks, miniaturization, and machine learning algorithms are also discussed. However, challenges related to sensor miniaturization, power consumption, cost efficiency, and compatibility with existing BMS need to be addressed to fully realize the potential of LiB sensor technologies. This comprehensive review provides valuable insights into the current landscape and future directions of sensor innovations in smart LiBs, guiding further research and development efforts to enhance battery performance, reliability, and safety. Integration of advanced sensor technologies for smart LiBs: integrating non-optical multi-parameter, optical-based, and electrochemical sensors within the BMS to achieve higher safety, improved efficiency, early warning mechanisms, and TR prevention. Potential advancements are driven by nanotechnology, wireless sensor networks, miniaturization, and advanced algorithms, addressing key challenges to enhance battery performance and reliability.

Keywords: Battery management systems; Lithium-based batteries; Sensors; State of charge; State of health; Thermal runaway.


Conflict of interest statement

Declarations. Conflict of interest: The authors declare no interest conflict. They have no known competing financial interests or personal relationships that could have appeared to influence the work reported in this paper.

Figures

None
Integration of advanced sensor technologies for smart LiBs: integrating non-optical multi-parameter, optical-based, and electrochemical sensors within the BMS to achieve higher safety, improved efficiency, early warning mechanisms, and TR prevention. Potential advancements are driven by nanotechnology, wireless sensor networks, miniaturization, and advanced algorithms, addressing key challenges to enhance battery performance and reliability.
Fig. 1
Fig. 1
Classification and contribution of sensor technologies based on application principles for smart LiBs monitoring. The insets include panels reproduced with permission for Magnetic field, ref. [20], from ACS; Gas sensor, ref. [21], from ACS; Acoustic sensor, ref. [22], from ACS; Pressure sensor, ref. [15], from Elsevier; Temperature sensor, ref. [23], from Elsevier; Strain sensor, ref. [24], from Elsevier; Fiber-optic sensor, ref. [25], from Springer Open; Ultraviolet spectroscopy, ref. [26], from Elsevier; Infrared spectroscopy, ref. [27], from MDPI; Amperometric sensor, ref. [28], from ACS; Potentiometric sensor, ref. [29], from ACS; Impedance sensor, ref. [30], from Cell Press
Fig. 2
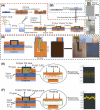
Fig. 2
Schematic illustrating the integration of LiB with temperature sensors. A The assembly process for the pouch LiB with integrated TFRTD. B The structure and manufacturing sequence of the flexible printed circuit (FPC) are from both its front and rear sides. The diagram also outlines the process of depositing TFRTD materials. The front structure of the FPC is presented as a composite of multiple layers. C Pouch cell integrated with a TFTC, D Steps involved in transferring TFTC onto Cu foil coated with SU8 2000.5. The TFTC embedded in polyimide is secured with Kapton® PI tape along its edges. The setup is immersed in a warm water bath to facilitate the removal of the PI-embedded TFTC, followed by the transfer of the detached TFTC onto the SU8 2000.5-coated Cu foil. E The Computed tomography (CT) images of an instrumented cell and its structure, including top-view images of the negative terminal post-instrumentation, the positive terminal from the top perspective, and a side view of the instrumented cell. F The process of fabricating smart LiB cells encompasses both pouch and cylindrical cell variants. The depiction progresses from the initial unmodified cell to the ultimate instrumented smart cell stage, with a focus on the insertion of the sensor. (Panel F also presents real-time X-ray images of the fully instrumented cells). G In situ examination of a LiB cell under high current load, highlighting fluctuations in skin temperature. The pronounced pulse discharge simulates the irregular acceleration patterns of an EV until the batteries are fully discharged. H High charge current, which holds significance in developing rapid charging profiles. The top-view X-ray image of a cell equipped with instrumentation visually depicts the increasing temperature differential between the cell’s internal and external environments. Panels reproduced with permission from A, B, ref. [23], Elsevier; C, D, ref. [42], Elsevier; E, ref. [40], Elsevier; F–H, ref. [57], Elsevier publishing
Fig. 3
Fig. 3
Schematic illustrating the integration of LiB with pressure sensors. A A thin-film piezoresistive pressure sensor with an operating mechanism designed for in situ measurements in LiB, B The structural details and components of the sensor, C Pressure-sensor current output correlation with exerted pressures, highlighting pressure sensitivity, D SEM image of sensor surface and gap. E Explosion pressure and cell temperature during Stage IV of the 1C overcharge test, demonstrating how the explosion pressure and cell temperature change in the cycle during this stage of the test, and F Pressure and pressure rate across the 1C overcharge test, showing pressure buildup rate in the cell during overcharge. G Locations of air-pressure sensors for LiB pressure monitoring, with respective coordinates, H Mechanism of air-pressure change within LiB module during battery TR. Panels reproduced with permission from A-D, ref. [65], Elsevier; E, F, ref. [53], Elsevier; G, H, ref. [17], Elsevier publishing
Fig. 4
Fig. 4
Performance and application of the microfiber strain sensor. A Stepwise resolution in low-strain regimes (0.005–0.025%), resolving 1 µm displacement. B Relative resistance change (ΔR/R0) versus strain, fitted to tunneling theory (adj. R2 = 0.99), showing linearity (GF = 9). C Durability over > 10,000 cycles at 1% strain. D Comparative analysis of detection limit (0.005%) and resolution against prior studies. E Real-time thickness change (Δz) of a LiB pouch cell during cycling, correlating sensor (edge) and reference (RDS, center) data. F Reproducible responses over four cycles. Panels reproduced with permission from A-F, ref. [16], Wiley–VCH
Fig. 5
Fig. 5
Performance of gas sensors in LiBs safety monitoring. A Schematic of battery energy storage system (BESS) cabin with three H2 gas sensors at varying distances, B The SEM images of graphite anode surface during LiB charging (with PVDF binder), C Similar to panel B but with a Li-metal electrode and graphite electrode (with PVDF binder), D H2 gas concentration variation curves of three sensors over 0–2500 s, E The detailed view of H2 gas concentration curves within 900–1150 s. F Rapid EIS of a single cell during OT test. Impedance at 0.1 Hz identified a failure marker (blue star) at 82 °C, G Gas sensor response during OT performed by VOC/Combined Gas/H2 sensors, H VOC/Combined Gas sensor response during OC test, I Rapid EIS test in a 1s4p pack during OC test, J Intervention test (1s4p OT). Deactivating heating at the EIS failure marker (~ 99 °C) prevented TR. K Location of the gas sensor (green) in the stainless-steel TR reactor setup, L Volumetric percentages of gases in four battery failure setups: electrolysis, electrolyte vapor, initial venting, and TR; The linear electrolyte components—DMC, DEC, and Ethyl methyl carbonate (CH3OCO2C2H5, EMC)—are equally present. Panels reproduced with permission from A-E, ref. [84], Cell Press; F-J, ref. [75] IOPSCIENCE; K, L, ref. [81], MDPI
Fig. 6
Fig. 6
Performance of acoustic sensors for ultrasonic monitoring of SoC and SoH in LiBs. A Non-destructive ultrasonic testing principle on a LiB pouch cell for SoC monitoring, B Attenuation histories of ultrasonic waves at frequencies 750 kHz, 1 MHz, and 1.5 MHz, C Correlation between attenuation history and SoC for the three frequencies. D Pulse-echo mode ultrasonic transducers for battery SoH monitoring, E Battery SoH performance during battery cycling, F Signal amplitude over multiple battery cycles (Signal at cycle 1 was considered as the baseline signal. The deviation observed at cycle 210 is more prominent than at cycle 100.), Overcharge process tests: G Voltage and current performance, H Battery view and X-ray images of the LiB before and after overcharge tests, I Battery surface temperature and temperature change rate during the constant charging process of 0.5C (0.9 A) to 5 V. Panels reproduced with permission from A-C, ref. [94], Elsevier; D-I, ref. [95], MDPI
Fig. 7
Fig. 7
Schematic illustration of the magnetic sensors, structure, and performance in LiB monitoring. A Schematic of the ME sensor, depicting its structural design and components, B Actual photograph of the ME sensor, C Magnetic field distribution in healthy power batteries before (B1, parts 1–4) and after various treatments (B2, parts 5–8). Magnetic field variation (∆B) is illustrated for untreated (9), externally extruded (10), over-discharged (11), and micro short-circuited (12) samples. D Magnetic field map measurements for fully charged cells with placement and image orientation (1–3), and field maps measured for the cells (4–5), E Series of magnetic field maps at discharge and charge cycles, labeled according to cell discharge capacity. Magnetic field maps are cross-referenced with maps from fully charged cells using RIT cells. Increased cell susceptibility was observed during the discharge process. Panels reproduced with permission from A-C, ref. [102], MPDI; D, E, ref. [103], Springer Nature Publishing
Fig. 8
Fig. 8
Schematic illustrating the performance of optical fiber sensors in LiB monitoring. A Results of 5C discharge at 25 °C ambient temperature, with cell surface temperature measured using DFOS and TC. The red dot indicates instantaneous max temperature by DFOS; (1) Evolution of current and voltage, (2) TC-measured temperature, (3), (4), (5), and (6) DFOS-measured temperatures and hotspots at regions 4, 3, 2, and 1 respectively, B Simplified graphical depiction of hotspot movement during 5C discharge at 25 °C ambient. C Integration of FBG into modified Swagelok cell and FBG sensor operational principle, D Time-resolved voltage (top) and Δλ, Δσ evolution (bottom) from FBG sensor in InLi0.6 | 1 M LiTFSI in DOL: DME | LTO cell with liquid electrolyte; FBG at anode/electrolyte interface, E Analogous plot for cell with FBG sensor embedded within InLix electrode. F Two-dimensional stack-view of reflected spectra by FBG sensor at the anode and electrolyte interface for cycles shown in D, G Analogous plot for cell with FBG sensor embedded within InLix electrode. Panels reproduced with permission from A, B, ref. [113], Elsevier; C-G, ref. [1], Springer Nature Publishing
Fig. 9
Fig. 9
Schematic illustrating the integration of fluorescence spectroscopy for Li-ion characteristic monitoring in LiB during operation. A PDMS microfluidic channel with placed LiCl crystal (red cube) at one end, B Monitoring Li-ion motion within the channel using widefield fluorescence microscopy, C Widefield images of illuminated channels captured at different intervals, illustrating Li-ion diffusion, D Quantitative fluorescence intensity analysis at rectangular ROIs (inset), plotted over time. E DMA probing measurement illustration, depicting DMA reaction with components on Li surface, F Visualizing Li distribution on cycled Li metal surface through DMA probing test, G Emission spectra of 5 mg mL−1 DMA in dry TEGDME/DME (1:1) before (blue) and after (red) Li metal treatment. Samples diluted 1/100 in TEGDME/DME (1:1) for measurable intensity. DMA solution fluorescence intensity at 500 nm was reduced by a factor of 15 after reaction, H Li deposition in Li|Li cell with a voltage profile of symmetric Li|Li cell under 2.5 mA cm−2 current density and 2.5 mAh cm−2 area capacity, I Series of fluorescence images (1–4) of Li foils after 1, 10, 50, and 100 cycles. Arrows in (3) and (4) highlight byproduct-dominated areas. Images labeled (1′–4′) provide optical views of areas enclosed in orange rectangles in fluorescence images, J Mean of fluorescence intensity of cycled Li after 1, 10, 50, and 100 cycles. The excitation wavelength (λex) is 378 nm; the scale for fluorescence images is 100 μm. Panels reproduced with permission from A-D, ref. [152], ACS; E-J, ref. [127], Wiley Publishing
Fig. 10
Fig. 10
Schematic illustrating the concentration changes of dissolved Mn-ions in the liquid electrolyte from LMO at different SoC using a refined in situ UV–vis spectroscopy monitoring. A The model of the cathode-electrolyte interface features a MO’s (110) slab and electrolytes, including EC, DMC, and LiPF6. This model highlights the presence of Mn-ions in varying valence states at the interface layer, demonstrating the synergistic movement of Mn4+ (Mn5) and its surrounding Mn3+ (Mn1, Mn3, and Mn22). B The oxidative decomposition process of EC molecules is presented in a stepwise manner, C The interaction between F from LiPF6 and the surface Mn-ion (F exhibiting minimal impact on Mn dissolution). D A comparative analysis of the absorption peak intensity and the concentration of dissolved Mn over storage time for electrolyte/LMO-p, electrolyte/LMO-c, and electrolyte/LMO-d at 45 °C (The inset provides a visual representation of electrolyte cuvettes after 60 days of storage). E The in situ UV–vis spectra of electrolyte/LMO-c with varying storage times (16, 24, 32, 40, and 48 h) at 45 °C. Panels reproduced with permission from A-E, ref. [128], ACS Publishing
Fig. 11
Fig. 11
Schematic illustrating the integration of operando Raman spectroscopy for electrolyte monitoring in LiB. A The continuous-wave laser light (785 nm) filtered and directed into the core of a single-ring HC-fiber, B single-ring HC-fiber connected to a syringe pump for on-demand sampling or infusion, C SEM image of the HC fiber, which has an outer diameter of 174 µm and a core diameter of 36 µm, as measured between the inner capillaries. The accompanying image displays the Raman signal as detected by the charge-coupled device (CCD) camera of the spectrometer. D Arrangement of the electrodes, separator, and the fiber probe within the LiB pouch cell. E Operando Raman spectroscopy during the formation cycle of an NMC811- graphite LiB pouch cell using an LP57 + 2 wt% VC electrolyte. The cell was charged galvanostatically to 4.3 V, maintained the potentiostate at 4.3 V, and then discharged. F Raman spectrum, underlining specific Raman modes of LiB electrolytes: (i) PF6 − anion, symmetric stretch (740 cm−1, green dashed line), (ii) EC, skeletal breathing mode (893 cm−1, dotted red line), and (iii) vinylene carbonate (1,2-epoxy-3-propenyl carbonate, VC), –HC = CH– (1628 cm−1, gray dash-dotted line). Panels reproduced with permission from A-F, ref. [133], Nature Portfolio Publishing
Fig. 12
Fig. 12
Schematic illustrating the fabrication and performance of amperometric H2 sensor for LiB monitoring. A Ti foam fabrication process for amperometric H2 sensor. B Electroplating step of H2 sensor. C Detailed H2 sensor structure. D Cyclic voltammetry (CV) performance of different H2 concentrations in aerobic conditions, followed by E Chronoamperometry at varying H2 concentrations. Insets in each graph display linear fits of chronoamperometry current to H2 concentration, highlighting direct proportionality between current and H2 concentration. Panels reproduced with permission from A-E, ref. [28], ACS Publishing
Fig. 13
Fig. 13
Schematic illustrating the synthetic structure of IC-MOF and the performance of conductometric sensors (both IC-MOF and Co/Pd-doped SnO2) for electrolyte leakage detection in LiB. IC-MOF thin films: A Synthetic structure of IC-MOF thin films by spraying porphyrin organic ligand solution onto the immiscible aqueous salt solution, and the structure of resultant IC-MOF thin films sensor. B Normalized current response of the IC-MOF sensor to 3000 ppm DMC gas. C Comparative analysis of normalized voltage between a leaked and a pristine LiB. Co/Pd-doped SnO2 sensor: D Response and recovery time to 10 ppm DMC at 150 °C. Panels reproduced with permission from A-C, ref. [187], Cell Press; D, ref. [188], Elsevier Publishing
Fig. 14
Fig. 14
Schematic illustrating the manufacturing sequence of LiBPTMS and its integration into a LiB. A LiBPTMS and anode fabrication process. B Cathode fabrication process. C LiB integrated with the LiBPTMS. D Cross-section, top-view, and a sample image of the LiBPTMS based on the PVDF-TrFE film coated on one side of the FPC. This provides a detailed view of the LiBPTMS, Panels E and F The construction and operational principle of the LiBPTMS, specifically focusing on E pressure and F thermal damage detection. Panels reproduced with permission from A-F, ref. [14], Elsevier
Fig. 15
Fig. 15
MEMS sensor technology fabrication for LiB monitoring. A The packaging process is initiated by machining a circular window in one half of a coin cell. Subsequently, double-sided adhesive conductive tape is utilized to mount the device, thereby making the Pyrex surface of the device visible through the window. The addition of electrolytes, separators, and lithium is carried out inside a glove box to prevent contamination. The package is then sealed to secure the components. B Production process of a flexible three-in-one microsensor. This involves the integration of three different sensing elements into a single, flexible device. The final product is shown in C accompanied by an optical micrograph that provided a detailed view of the sensor structure. D Schematic diagram of the flexible three-in-one microsensors package assembly embedded in a LiB coin cell. This diagram provides a visual representation of how the sensors are integrated into the coin cell, highlighting the compact and efficient design of the device. E Schematic concept of the battery pack. F Dynamic response of TiO2/CuO/Cu2O samples with thicknesses of 10 nm (denoted as Cu10) at an operating temperature of 350 °C to 1, 5, 10, 50, 100, 500, and 1000 ppm of C4H10O2 vapors. Panels reproduced with permission from A, ref. [208], IOP; B-D, ref. [198], MDPI; E, F, ref. [211], ACS Publishing

Similar articles

References

    1. L. Albero Blanquer, F. Marchini, J.R. Seitz, N. Daher, F. Bétermier et al., Optical sensors for operando stress monitoring in lithium-based batteries containing solid-state or liquid electrolytes. Nat. Commun. 13(1), 1153 (2022). 10.1038/s41467-022-28792-w - PMC - PubMed
    1. A. Jinasena, L. Spitthoff, M.S. Wahl, J.J. Lamb, P.R. Shearing et al., Online internal temperature sensors in lithium-ion batteries: state-of-the-art and future trends. Front. Chem. Eng. 4, 804704 (2022). 10.3389/fceng.2022.804704
    1. J. Xiao, F. Shi, T. Glossmann, C. Burnett, Z. Liu, From laboratory innovations to materials manufacturing for lithium-based batteries. Nat. Energy 8(4), 329–339 (2023). 10.1038/s41560-023-01221-y
    1. X.-B. Cheng, C.-Z. Zhao, Y.-X. Yao, H. Liu, Q. Zhang, Recent advances in energy chemistry between solid-state electrolyte and safe lithium-metal anodes. Chem 5(1), 74–96 (2019). 10.1016/j.chempr.2018.12.002
    1. P.K. Kausthubharam, S. Koorata, Panchal, Thermal management of large-sized LiFePO4 pouch cell using simplified mini-channel cold plates. Appl. Therm. Eng. 234, 121286 (2023). 10.1016/j.applthermaleng.2023.121286

LinkOut - more resources